


The leakage, low temperature diffusion and explosion of liquefied natural gas in open space
-
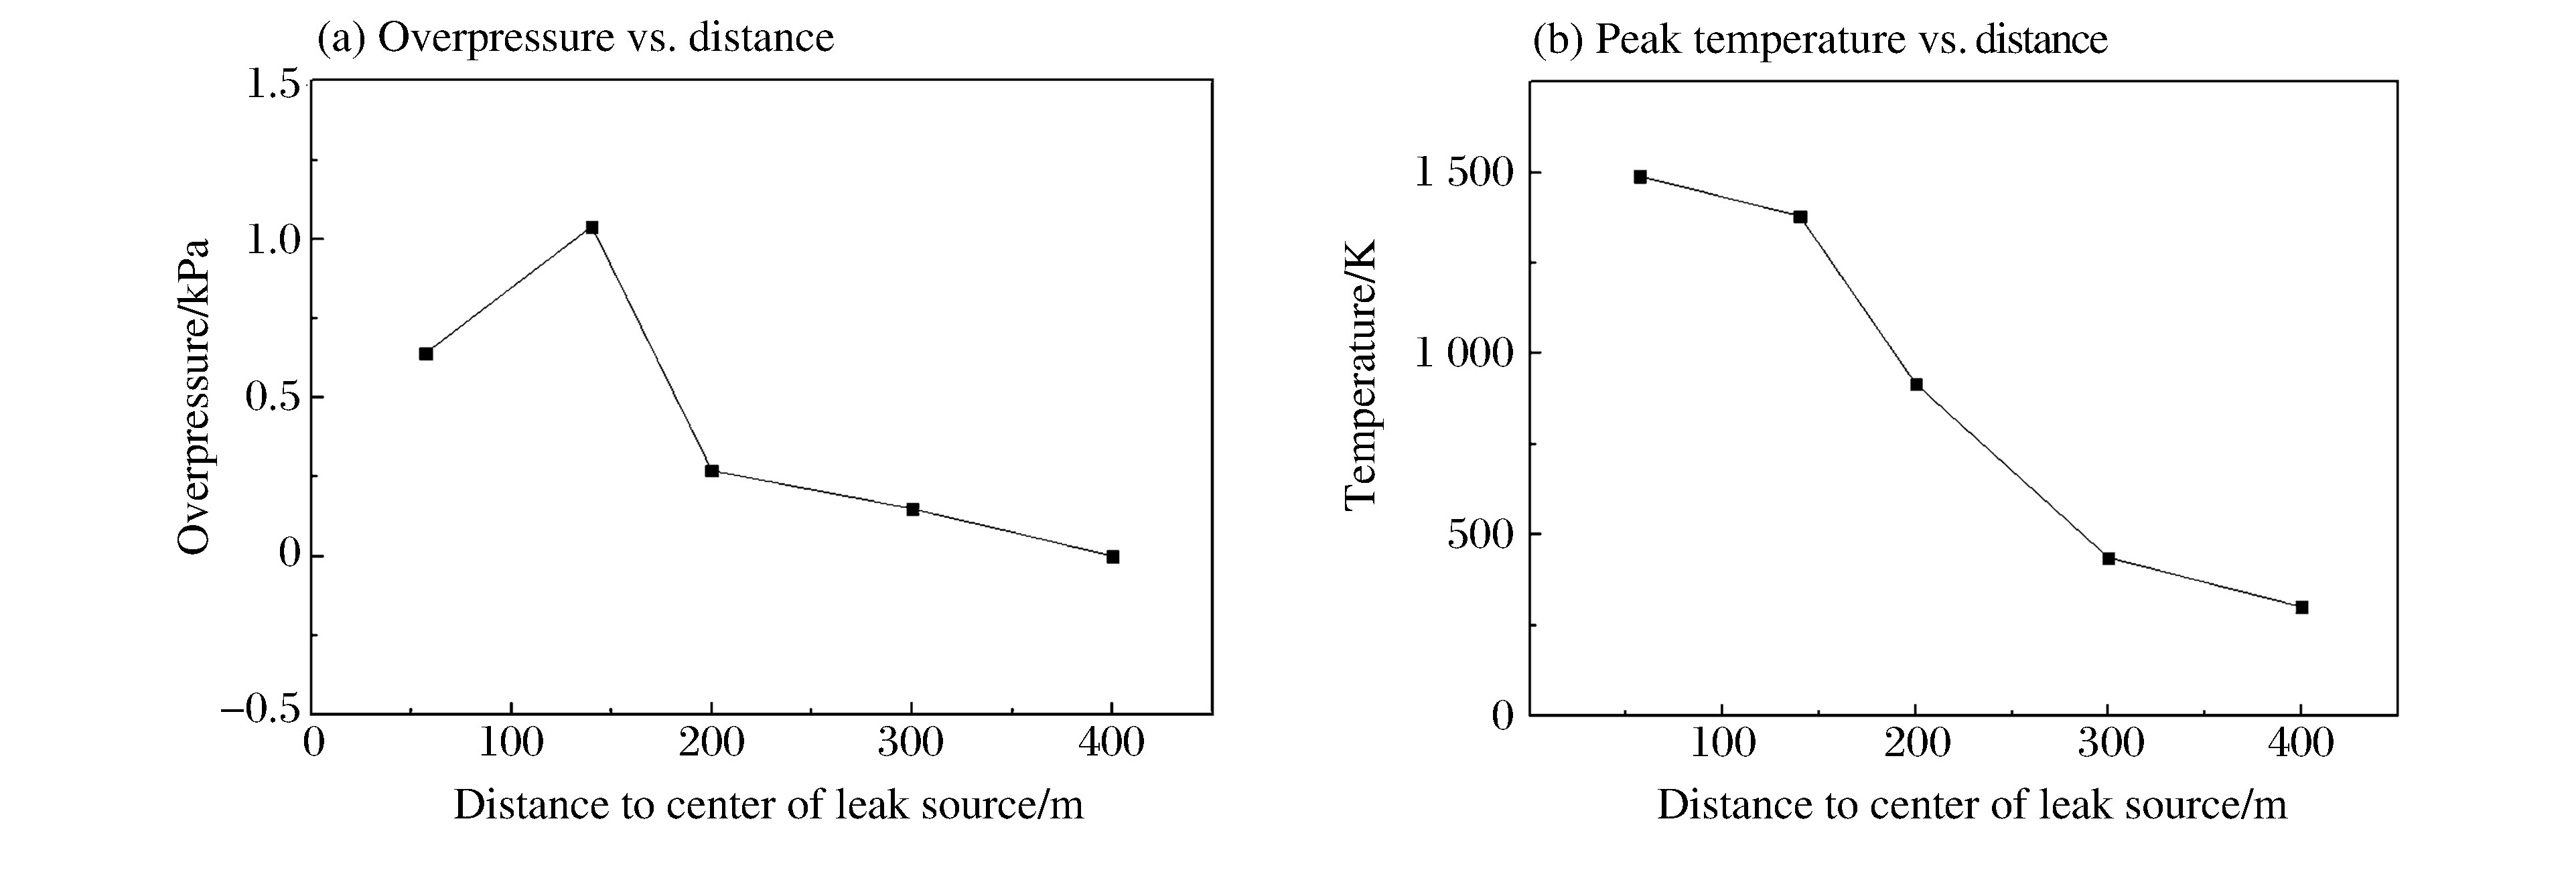
摘要: 低温可导致人员冻伤及物品脆裂,气体爆炸传播规律是爆炸演化过程和事故分析的基础。采用数值模拟方法,研究液化天然气大面积泄漏汽化过程、甲烷与空气混合过程及爆炸传播过程。结果表明:随着扩散距离的增大,低温区域的温度谷值升高,且升高趋势变缓;在距泄漏源中心110 m范围内,温度低于273 K;随着风速的增加,温度谷值呈线性下降;随着泄漏时间的延长,温度谷值降低,且下降趋势变缓;随着距泄漏中心距离的增加,爆炸后超压峰值先升高后降低;在距泄漏源中心200 m范围内,爆炸产生的高温会对人员造成伤害。Abstract: It is known that low-temperature is apt to cause skin frost bite and material embrittlement, and that the propagation law of gas explosion is the foundation of explosion evolution and accident analysis. In this paper, we investigated the process of extensive gas leakage, gas mixing with air and explosion of the liquefied natural gas (LNG) in open space using numerical simulation. The results show that, as the diffusion distance increases, the lowest possible fluctuating temperature (i.e. temperature valley) of LNG increases, and this tendency gradually slows down; that the temperature is below 273 K in the area within 110 m away from the leakage center; that the temperature valley decreases almost linearly as the wind velocity increases. As the leakage time gets longer, the temperature valley decreases, and so does its decreasing tendency. With the distance from the leakage center getting longer, the peak overpressure increases at first and then decreases. In the area within 200 m away from the leakage center, the high temperature produced by the explosion may pose a hazard to human casualties.
-
Key words:
- liquefied natural gas /
- leaking /
- low temperature /
- concentration distribution /
- explosion
-
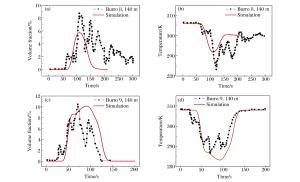
图 3 甲烷体积分数和温度的数值计算结果与实验数据的对比
Figure 3. Comparison of methane volume fraction and temperature between calculation and experimental results
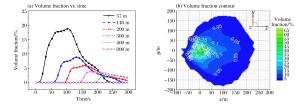
图 7 甲烷体积分数-时间曲线及云图(监测点距地面1 m高
Figure 7. Methane's volume fraction-time curve and contour (Distance from monitoring point to the ground is 1 m)
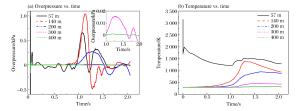
图 8 不同监测点的超压和温度随时间变化曲线
Figure 8. Overpressure and temperature vs. time at different distances away from leakage center

图 9 不同位置的超压峰值和温度峰值变化趋势
Figure 9. Variation of peak overpressure and peak temperature with distances away from leakage center
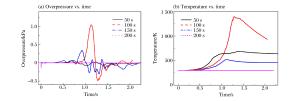
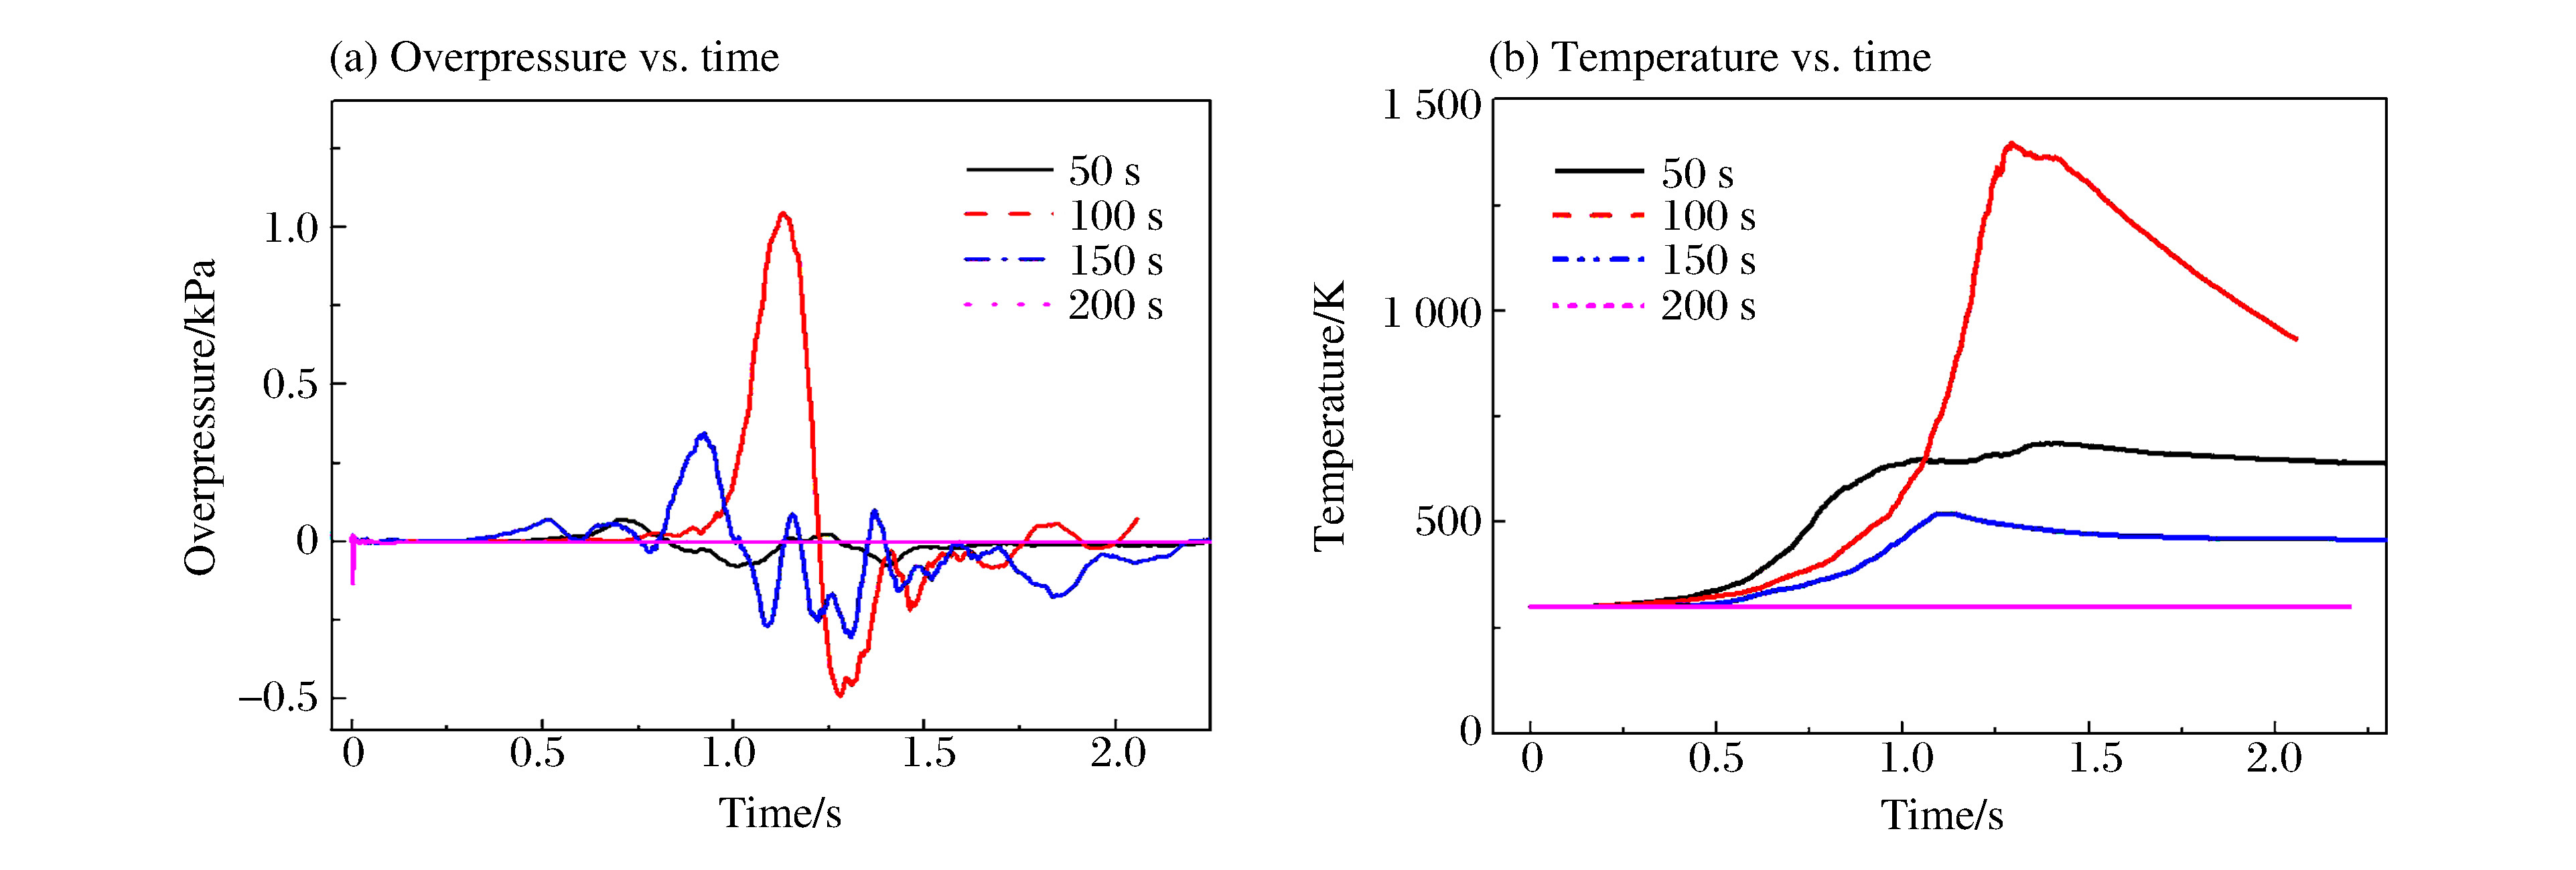
图 10 不同时刻点火爆炸压力和温度随时间变化曲线
Figure 10. Overpressure-time and temperature-time curves at different ignition times
-
[1] ZHANG X, LI J, ZHU J, et al. Computational fluid dynamics study on liquefied natural gas dispersion with phase change of water[J]. International Journal of Heat and Mass Transfer, 2015, 91:347-354. doi: 10.1016/j.ijheatmasstransfer.2015.07.117 [2] LUKETA-HANLIN A, KOOPMAN R P, ERMAK D L. On the application of computational fluid dynamics codes for liquefied natural gas dispersion[J]. Journal of Hazardous Materials, 2007, 140(3):504-517. doi: 10.1016/j.jhazmat.2006.10.023 [3] 王卿权. LNG动力船舶燃料罐火灾、爆炸事故后果数值研究[D]. 大连: 大连海事大学, 2014. http://www.wanfangdata.com.cn/details/detail.do?_type=degree&id=Y2583858 [4] PLANAS E, PASTOR E, CASAL J, et al. Analysis of the boiling liquid expanding vapor explosion (BLEVE) of a liquefied natural gas road tanker: The Zarzalico accident[J]. Journal of Loss Prevention in the Process Industries, 2015, 34:127-138. doi: 10.1016/j.jlp.2015.01.026 [5] REN S, ZHANG Q. Influence of concentration distribution of hydrogen in air on measured flammability limits[J]. Journal of Loss Prevention in the Process Industries, 2015, 34:82-91. doi: 10.1016/j.jlp.2015.01.027 [6] GAVELLI F, BULLISTER E, KYTOMAA H. Application of CFD (Fluent) to LNG spills into geometrically complex environments[J]. Journal of Hazardous Materials, 2008, 159(1):158-168. doi: 10.1016/j.jhazmat.2008.02.037 [7] SUN B, UTIKAR R P, PAREEK V K, et al. Computational fluid dynamics analysis of liquefied natural gas dispersion for risk assessment strategies[J]. Journal of Loss Prevention in the Process Industries, 2013, 26(1):117-128. doi: 10.1016/j.jlp.2012.10.002 [8] KOOPMAN R P, CEDERWALL R T, ERMAK D L, et al. Analysis of Burro series 40 m3 LNG spill experiments[J]. Journal of Hazardous Materials, 1982, 6(1/2):43-83. https://www.researchgate.net/publication/236350847_Analysis_of_turbulent_wind-velocity_and_gas-concentration_fluctuations_during_the_Burro_series_40-msup_3_LNG_spill_experiments -

 下载:
下载:


计量
- 文章访问数: 5514
- HTML全文浏览量: 1424
- PDF下载量: 244
- 被引次数: 0