


Material failure models in SPH simulation of debris cloud
-
摘要: 光滑粒子流体动力学方法(smoothed particle hydrodynamics,SPH)被广泛应用于薄板超高速撞击碎片云的数值模拟。利用AUTODYN软件中的SPH模块,考察了无失效模型、Grady失效模型和最大拉应力失效模型3种方案下碎片云模拟结果,发现无失效模型时计算结果及材料表现与实验明显不符;相比于Grady失效模型,最大拉应力失效模型下材料更难失效,将小幅度减弱碎片云扩散程度,碎片总数减少,粒子聚集产生更大碎片,碎片云侵彻性能提高,增大模型失效阈值亦有上述表现。相比而言,Grady失效模型计算结果更符合实验,但2种失效模型间差异与撞击工况相关,材料破碎越充分差异越小。Abstract: The smoothed particle hydrodynamics (SPH) method is widely used in debris cloud simulation under hypervelocity impact. The SPH solver in AUTODYN was employed to investigate the effects of the no-failure model, the Grady failure model and the maximum tension failure model on the simulation results of debris cloud. When using the no-failure model, the simulation result and material response were not consistent with the experiment. Compared with the Grady model, the material under the maximum tension model was more difficult to fail, which would slightly weaken the expansion of debris cloud, produce less but heavier debris because of particles gathering, and thus improve the penetration performance of debris cloud. Similarly, by increasing the failure stress threshold, the above result was also obtained. Considering the material response and debris distribution, the simulation result by the Grady model was closer to the experiment. However, the difference between the Grady model and the maximum tension model was related to the impact condition, and more complete fragmentation of the material would lead to a smaller difference.
-
Key words:
- failure model /
- SPH method /
- debris cloud /
- debris distribution /
- hypervelocity impact
-
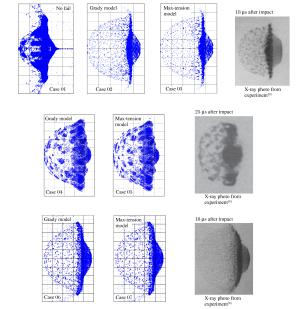
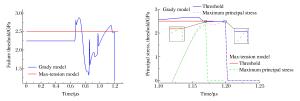
图 4 材料失效阈值变化及对应失效规则触发的示例
Figure 4. An instance of material failure regulation and its failure threshold-time curve
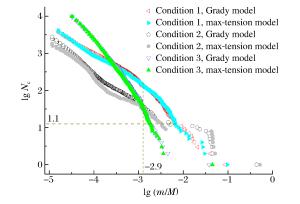
图 6 0.01 mg以上碎片累计数量分布
Figure 6. Distribution of cumulative number of debris above 0.01 mg
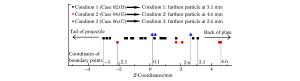
图 7 模型中轴线上不同失效模型下失效表现不同的粒子点
Figure 7. Particles with different failure performance under Grady and max-tension models
图 8 圆盘中心粒子失效时刻压力的变化
Figure 8. Pressure-time curves of the center particles of the disc projectile
图 10 0.01 mg以上碎片累计数量分布
Figure 10. Distribution of cumulative number of debris above 0.01 mg
表 1 各算例的设置
Table 1. Settings of various cases
工况 算例 薄板厚度/mm 撞击速度/(km·s-1) 失效模型 1 01 0.467 6.62 无 1 02 0.467 6.62 Grady模型 1 03 0.467 6.62 最大拉应力模型 2 04 0.467 4.71 Grady模型 2 05 0.467 4.71 最大拉应力模型 3 06 0.972 6.72 Grady模型 3 07 0.972 6.72 最大拉应力模型  下载: 导出CSV
表 2 最大碎片球等效直径计算值与实验值对比(单位:mm)
Table 2. Comparison of simulation and experiment results of equivalent diameters of the largest fragments (unit in mm)
工况 Grady模型 最大拉应力模型 实验值 1 2.82 2.51 2.95 2 6.23 5.92 6.36 3 1.30 1.28 1.45
下载: 导出CSV
表 3 不同临界应变常数下碎片统计信息
Table 3. Detail information related to debris statistics under different critical strains
εc 碎片总数 最大碎片/mg 0.15 177 832 14.43 0.30 161 616 22.23 0.45 152 956 31.21 0.60 145 480 34.14
下载: 导出CSV
-
[1] LIU G R, LIU M B.光滑粒子流体动力学: 一种无网格粒子法[M].韩旭, 杨刚, 强洪夫, 译.长沙: 湖南大学出版社, 2005: 12-32. [2] GROENENBOOM P H L. Numerical simulation of 2D and 3D hypervelocity impact using the SPH option in PAM-SHOCKTM[J]. International Journal of Impact Engineering, 1997, 20(1/2/3/4/5):309-323. DOI: 10.1016/S0734-743X(97)87503-3. [3] 张伟, 庞宝君, 贾斌, 等.弹丸超高速撞击防护屏碎片云数值模拟[J].高压物理学报, 2004, 18(1):47-52. DOI: 10.3969/j.issn.1000-5773.2004.01.009.ZHANG Wei, PANG Baojun, JIA Bin, et al. Numerical simulation of debris cloud produced by hypervelocity impact of projectile on bumper[J]. Chinese Journal of High Pressure Physics, 2004, 18(1):47-52. DOI: 10.3969/j.issn.1000-5773.2004.01.009. [4] HIGASHIDE M E, KHISHCHENKO K V, LEVASHOV P R. Hypervelocity impact modeling with different equations of state[J]. International Journal of Impact Engineering, 2006, 33(1/2/3/4/5/6/7/8/9/10/11/12):625-633. DOI: 10.1016/j.ijimpeng.2006.09.078. [5] 李宝宝, 汤文辉, 冉宪文.两种物态方程在超高速碰撞数值模拟中的比较[J].航天器环境工程, 2010, 27(5):576-580. DOI: 10.3969/j.issn.1673-1379.2010.05.006.LI Baobao, TANG Wenhui, RAN Xianwen. Comparison of two kinds of equation of state in numerical simulation of hypervelocity impact[J]. Spacecraft Environment Engineering, 2010, 27(5):576-580. DOI: 10.3969/j.issn.1673-1379.2010.05.006. [6] PIEKUTOWSKI A J. Formation and description of debris cloud produced by hypervelocity impact: NASA CR-4707[R]. USA: NASA, 1996. [7] GRADY D E. The spall strength of condensed matter[J]. Journal of the Mechanics and Physics of Solids, 1988, 36(3):353-384. DOI: 10.1016/0022-5096(88)90015-4. [8] PIEKUTOWSKI A J. A simple dynamic model for the formation of debris clouds[J]. International Journal of Impact Engineering, 1990, 10(1/2/3/4):453-471. DOI: 10.1016/0734-743X(90)90079-B. -


计量
- 文章访问数: 6025
- HTML全文浏览量: 1726
- PDF下载量: 391
- 被引次数: 0