Processing math: 100%
  • ISSN 1001-1455  CN 51-1148/O3
  • EI、Scopus、CA、JST收录
  • 力学类中文核心期刊
  • 中国科技核心期刊、CSCD统计源期刊

全尺寸干线输气管道爆炸地振动的空间分布和时频分布特性

马华原 龙源 李兴华 钟明寿 周辉 吴建源

马华原, 龙源, 李兴华, 钟明寿, 周辉, 吴建源. 全尺寸干线输气管道爆炸地振动的空间分布和时频分布特性[J]. 爆炸与冲击, 2019, 39(4): 042201. doi: 10.11883/bzycj-2018-0123
引用本文: 马华原, 龙源, 李兴华, 钟明寿, 周辉, 吴建源. 全尺寸干线输气管道爆炸地振动的空间分布和时频分布特性[J]. 爆炸与冲击, 2019, 39(4): 042201. doi: 10.11883/bzycj-2018-0123
MA Huayuan, LONG Yuan, LI Xinghua, ZHONG Mingshou, ZHOU Hui, WU Jianyuan. Characteristics of space and time-frequency distribution of the vibration in full-scale trunk gas pipeline explosion[J]. Explosion And Shock Waves, 2019, 39(4): 042201. doi: 10.11883/bzycj-2018-0123
Citation: MA Huayuan, LONG Yuan, LI Xinghua, ZHONG Mingshou, ZHOU Hui, WU Jianyuan. Characteristics of space and time-frequency distribution of the vibration in full-scale trunk gas pipeline explosion[J]. Explosion And Shock Waves, 2019, 39(4): 042201. doi: 10.11883/bzycj-2018-0123

全尺寸干线输气管道爆炸地振动的空间分布和时频分布特性

doi: 10.11883/bzycj-2018-0123
基金项目: 国家自然科学基金(11672331,51608530)
详细信息
    作者简介:

    马华原(1992- ),男,博士研究生,503812350@qq.com

    通讯作者:

    龙 源(1958- ),男,博士,教授,914800684@qq.com

  • 中图分类号: O384

Characteristics of space and time-frequency distribution of the vibration in full-scale trunk gas pipeline explosion

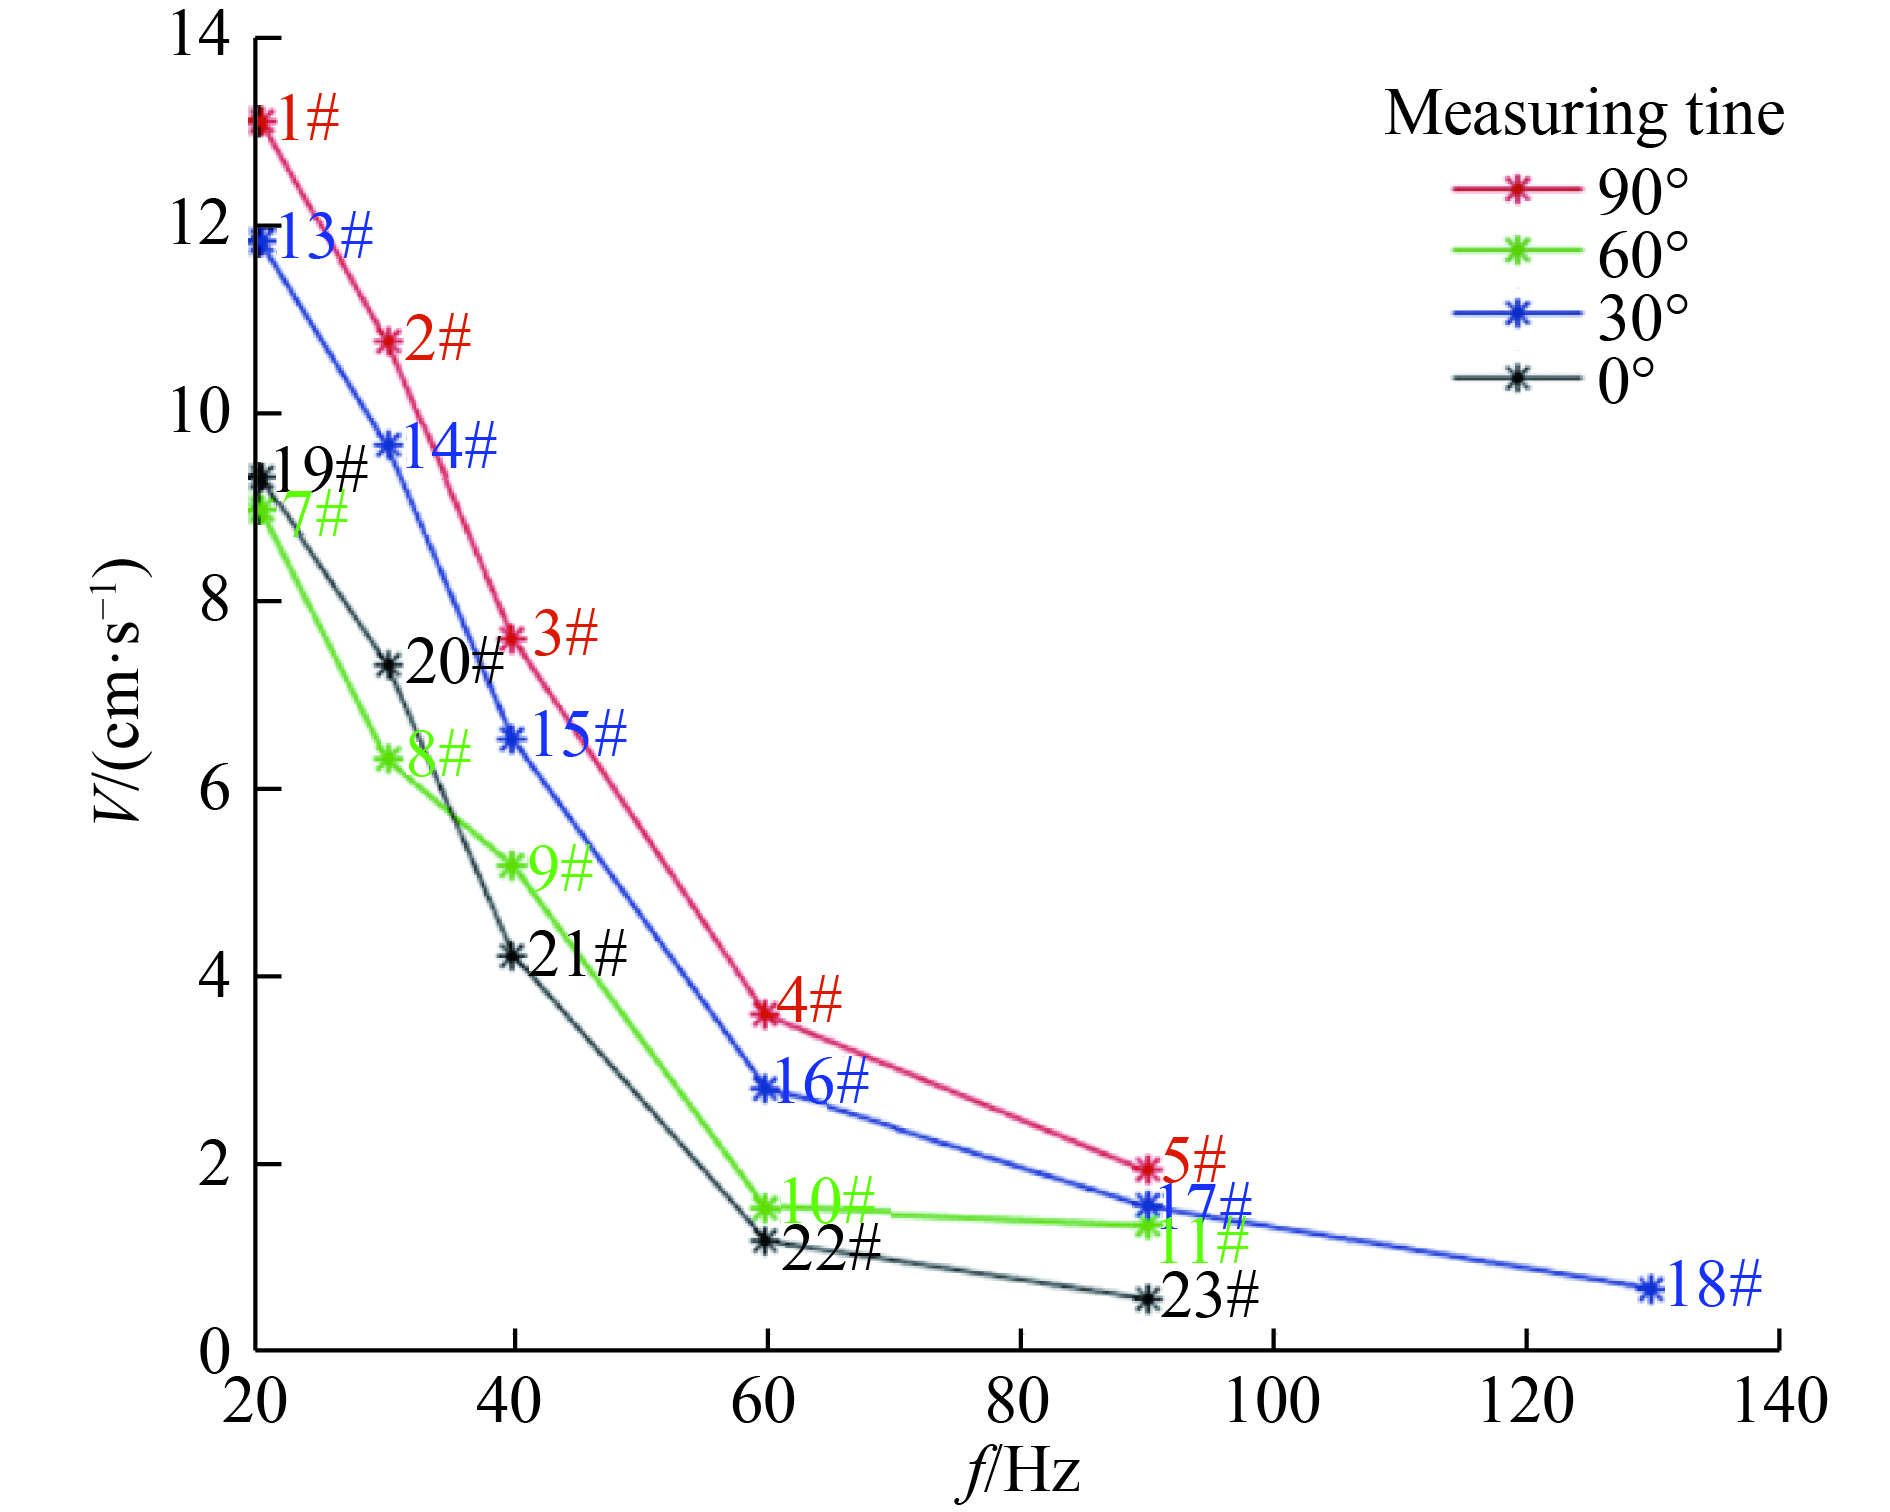
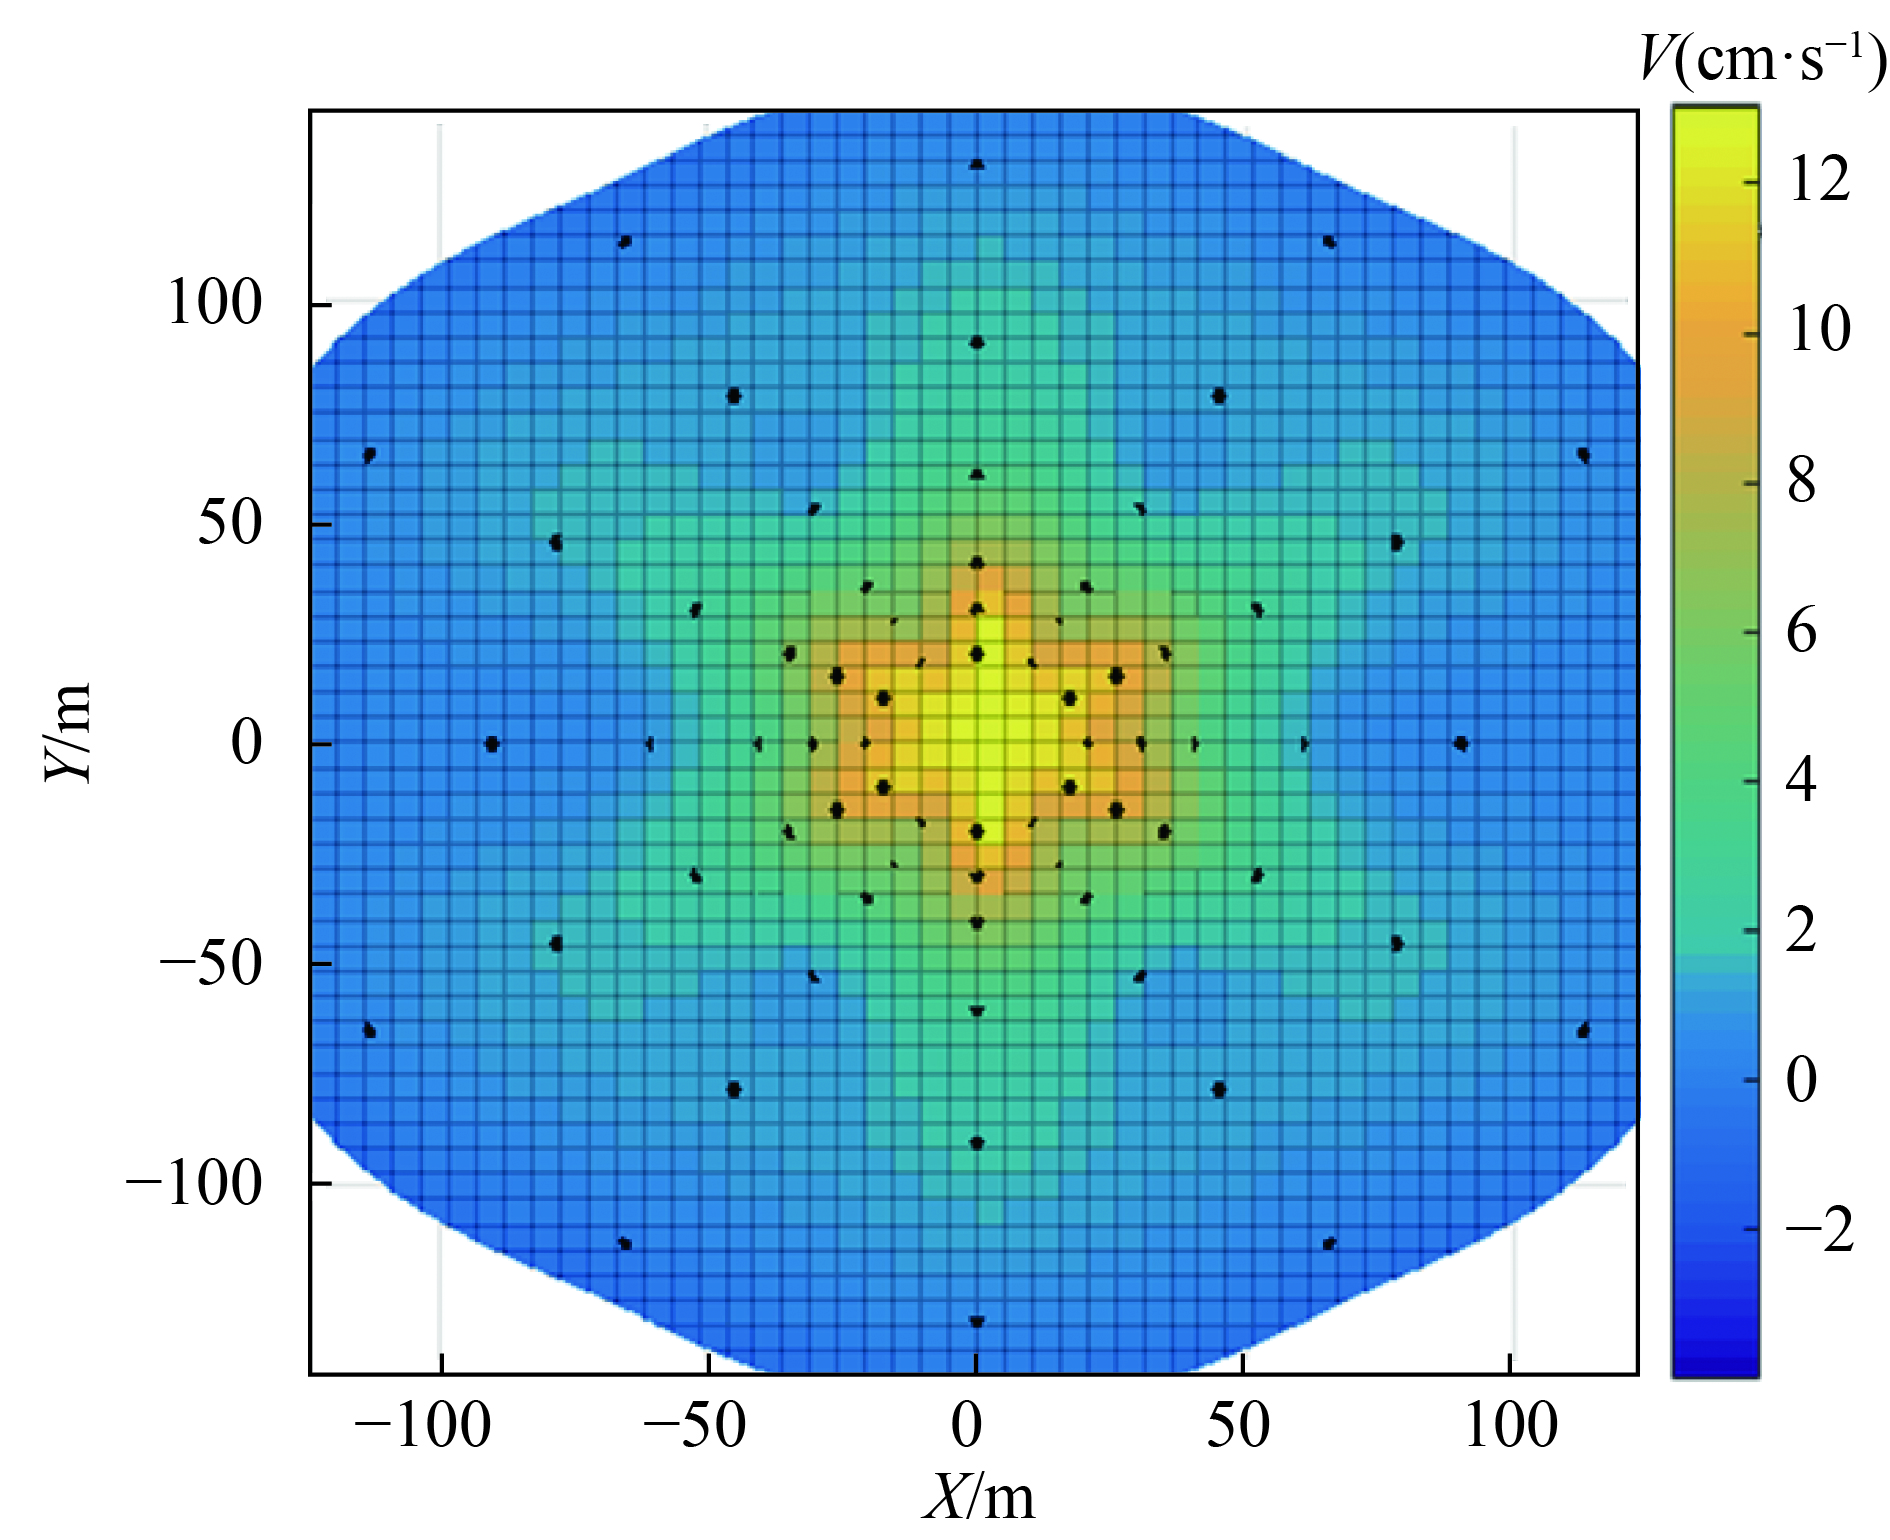
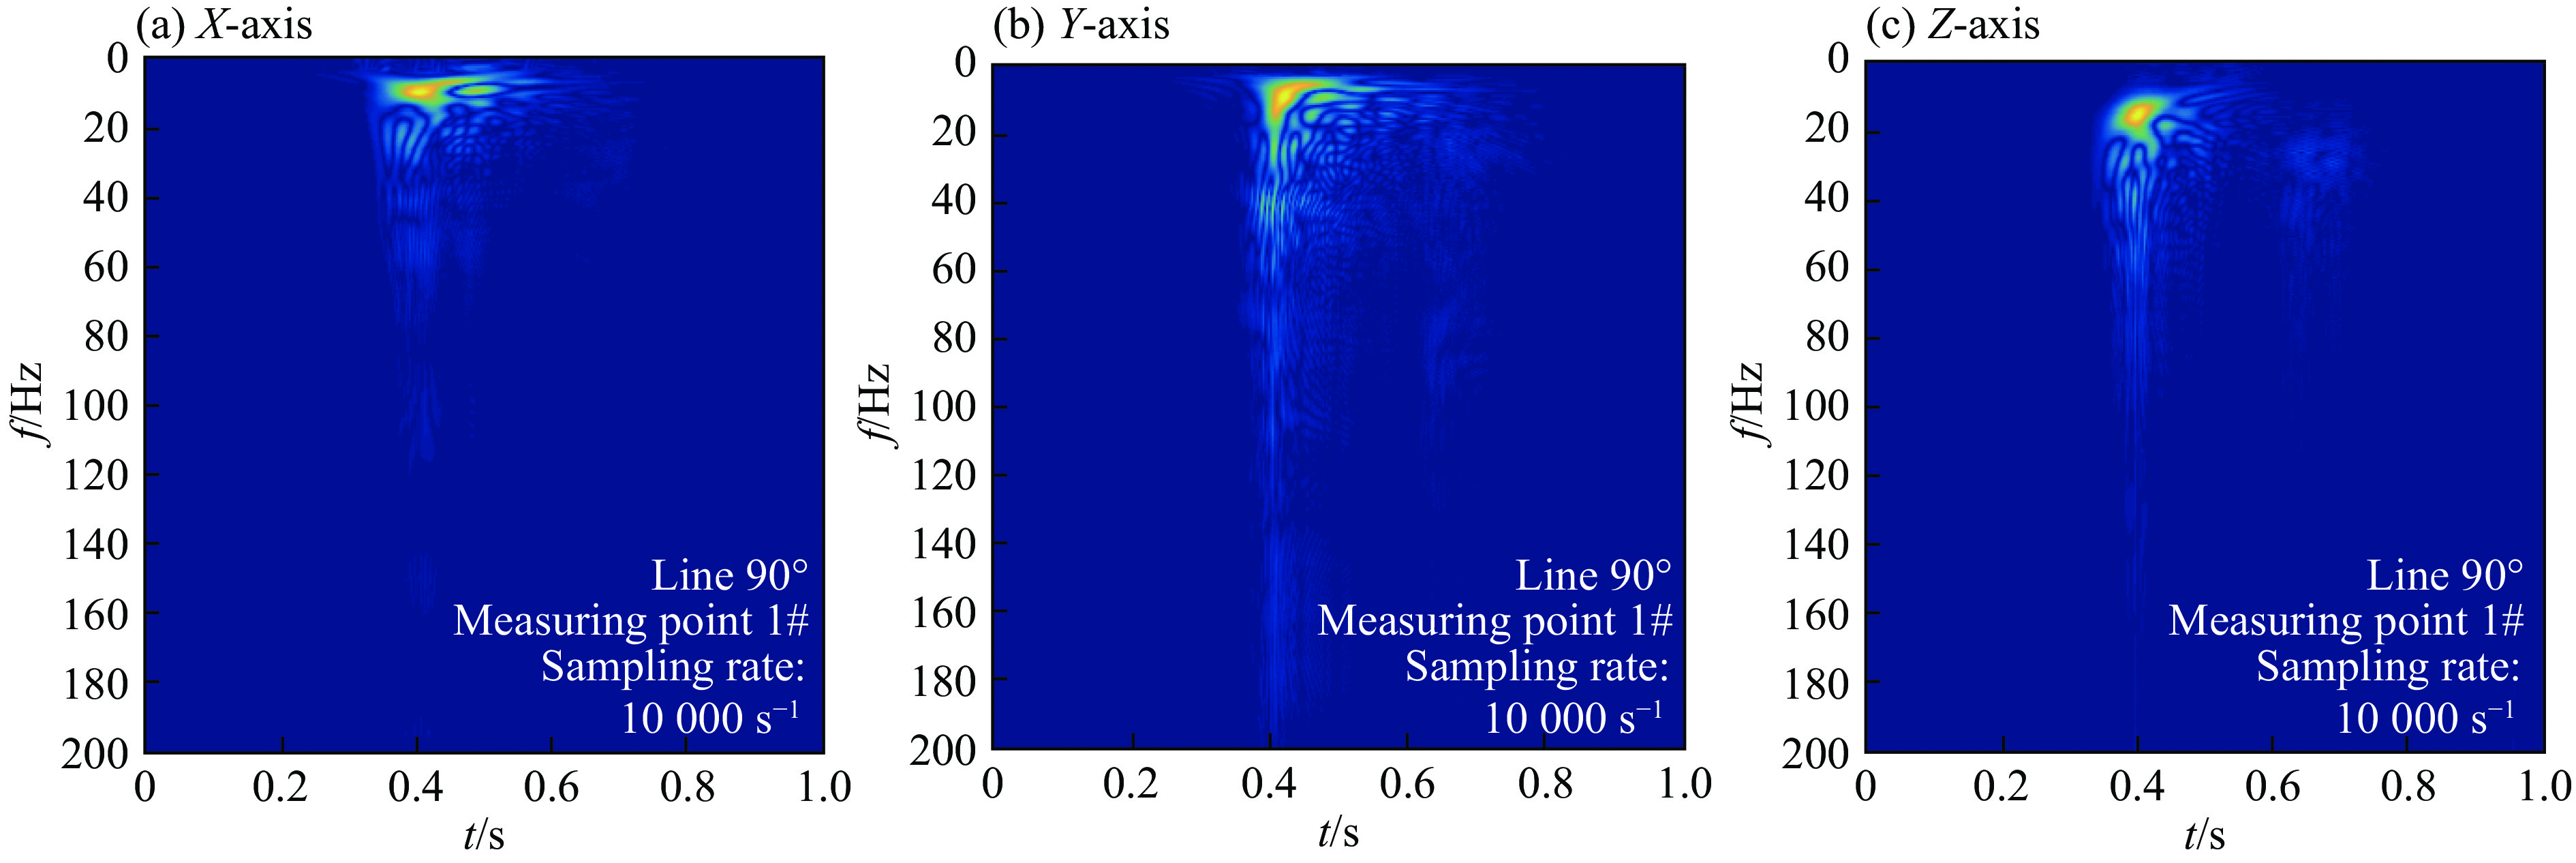
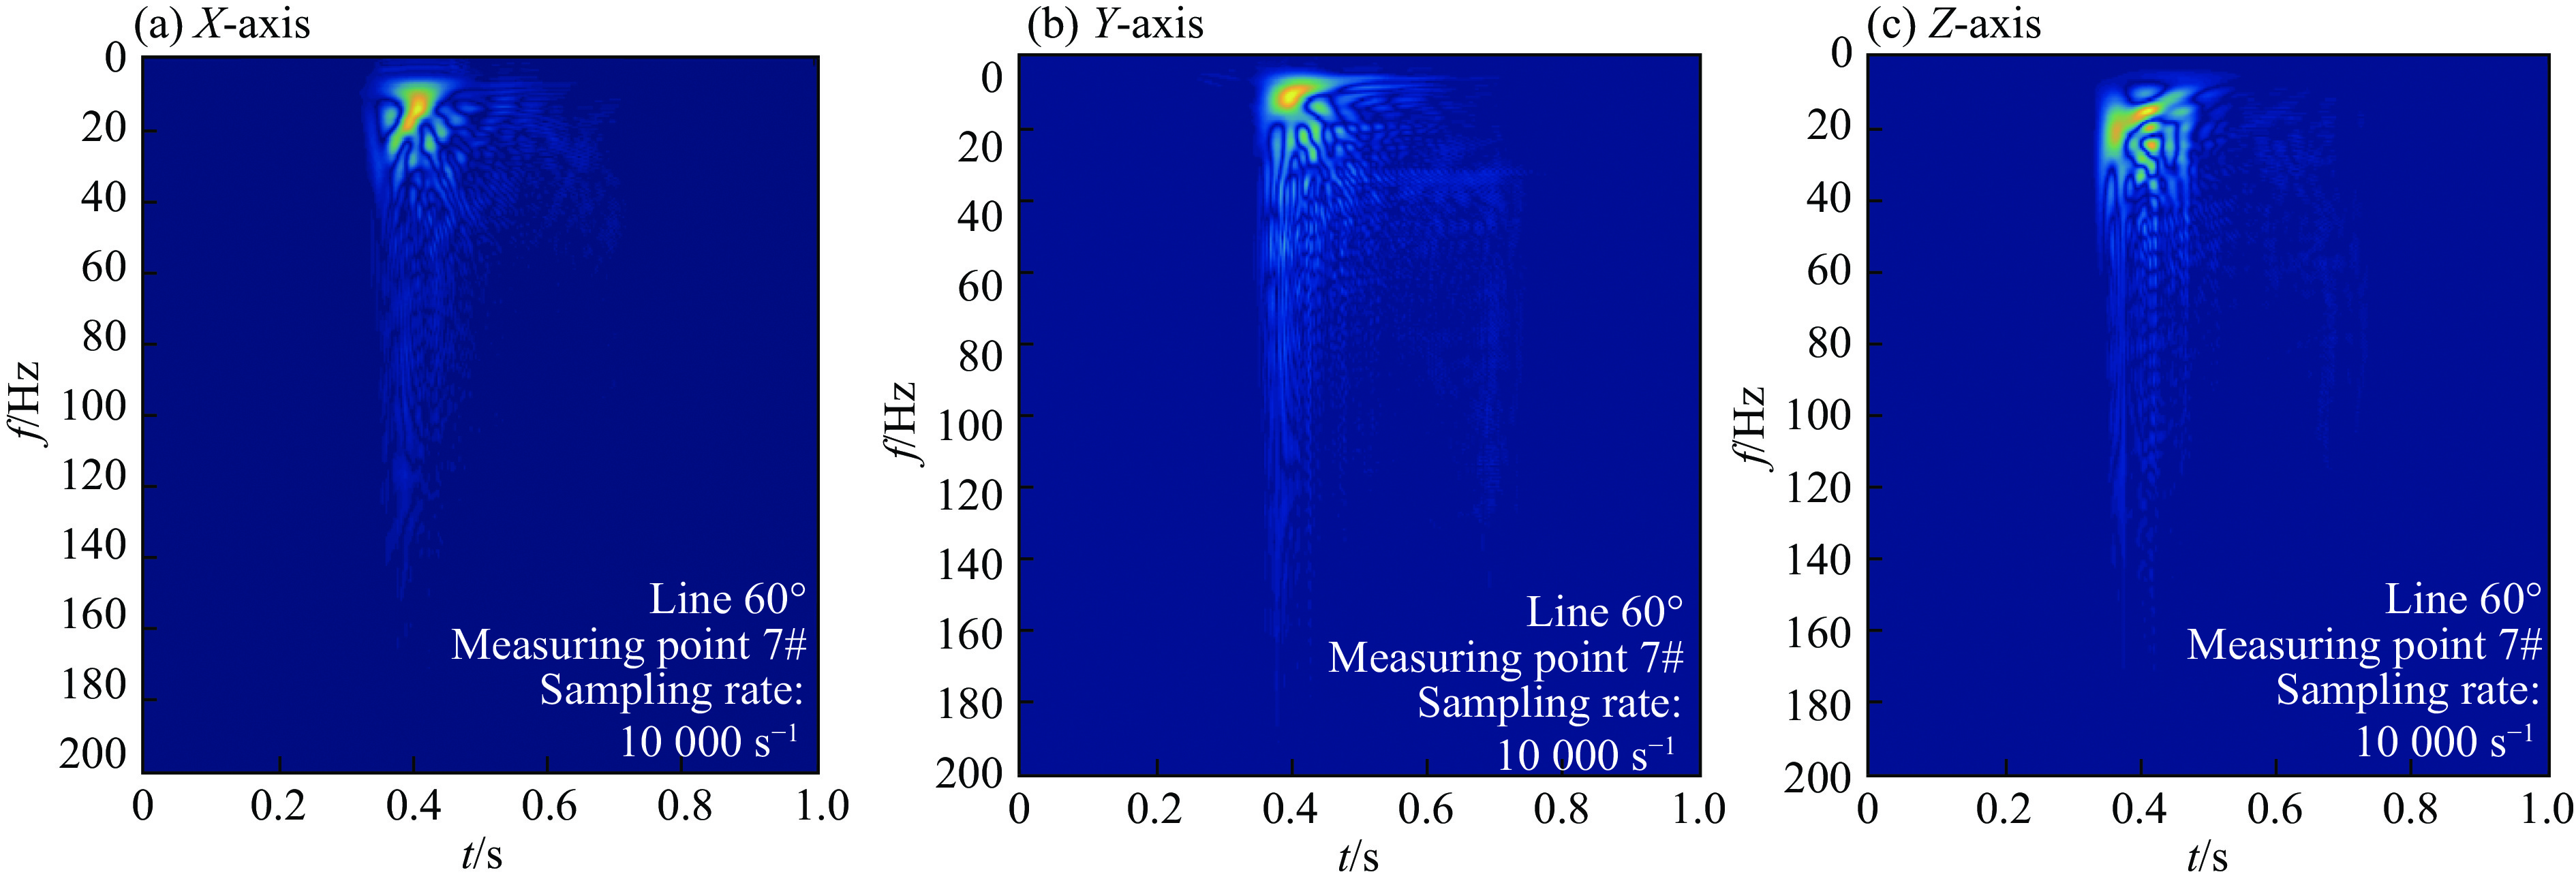
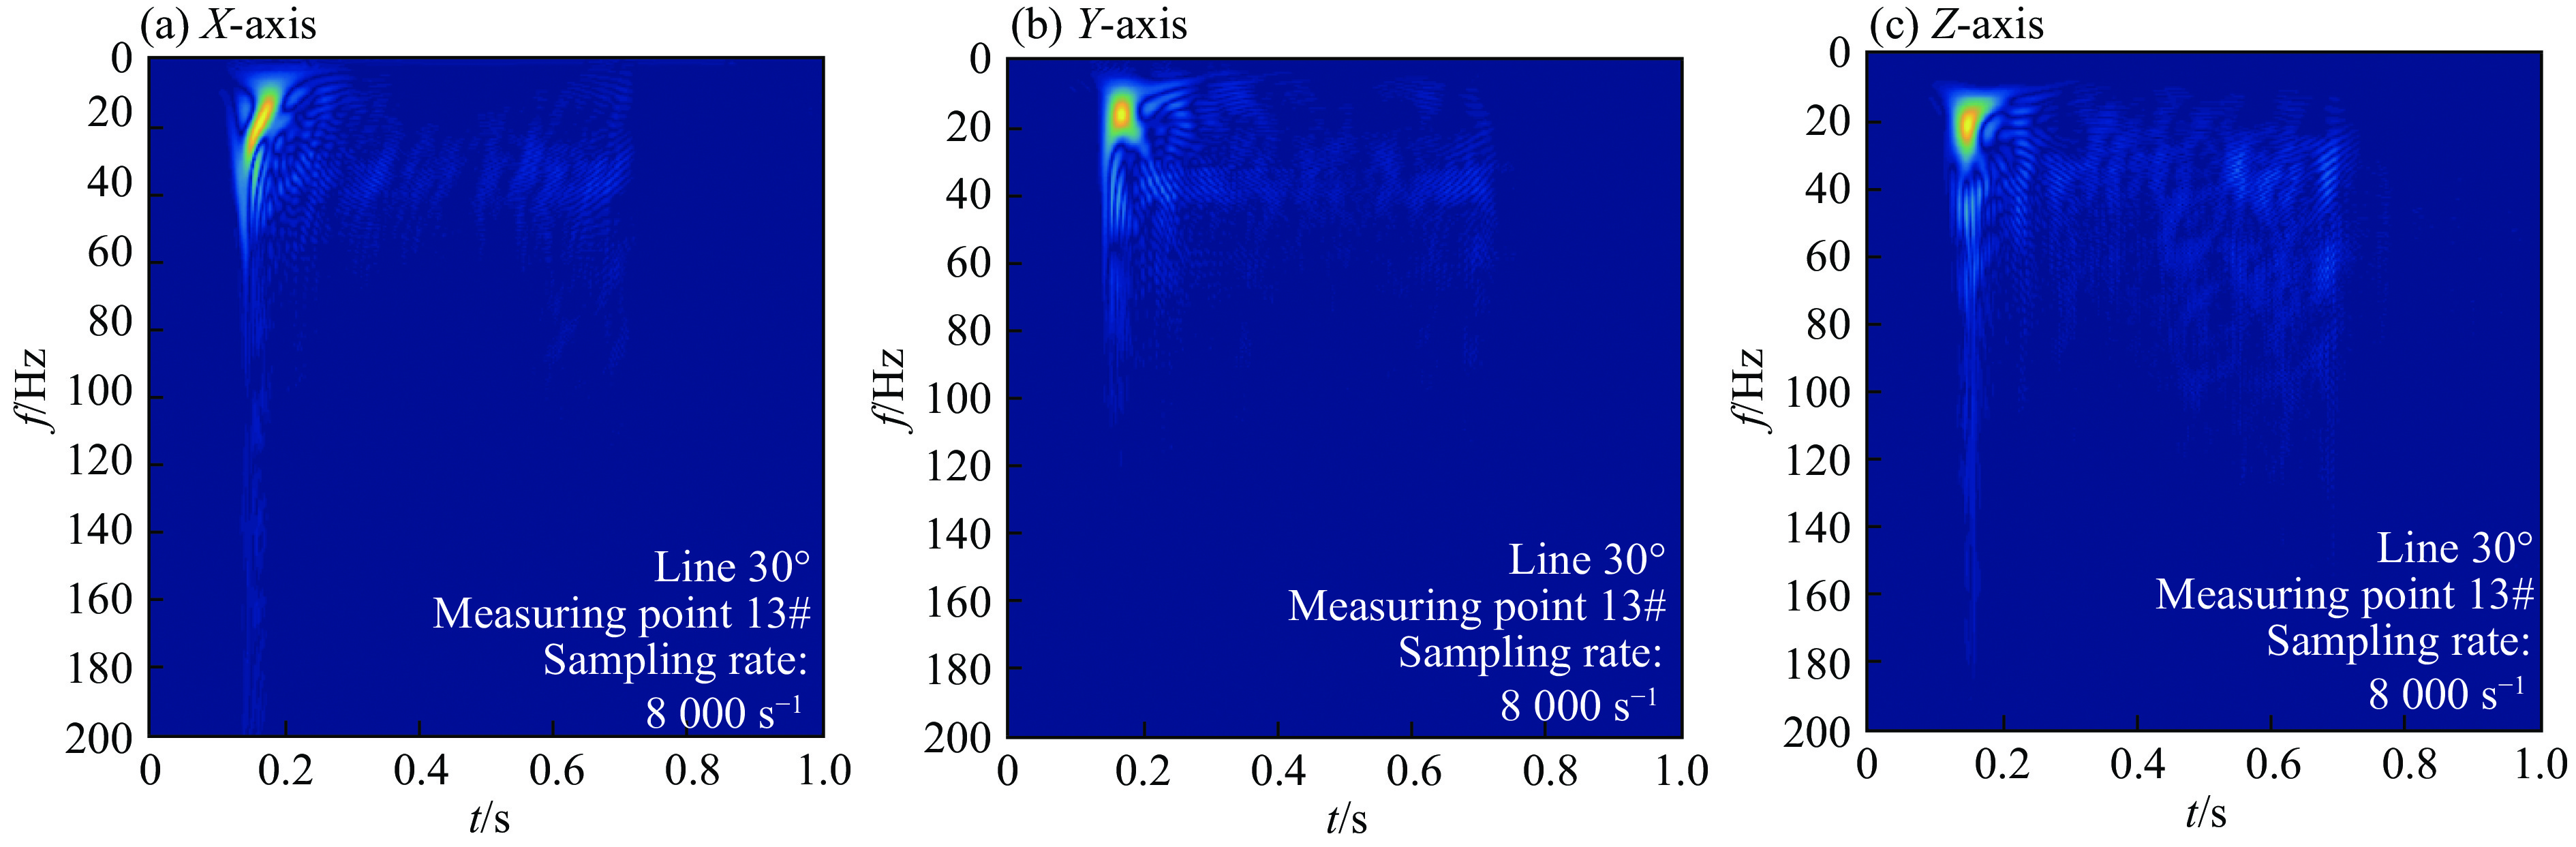
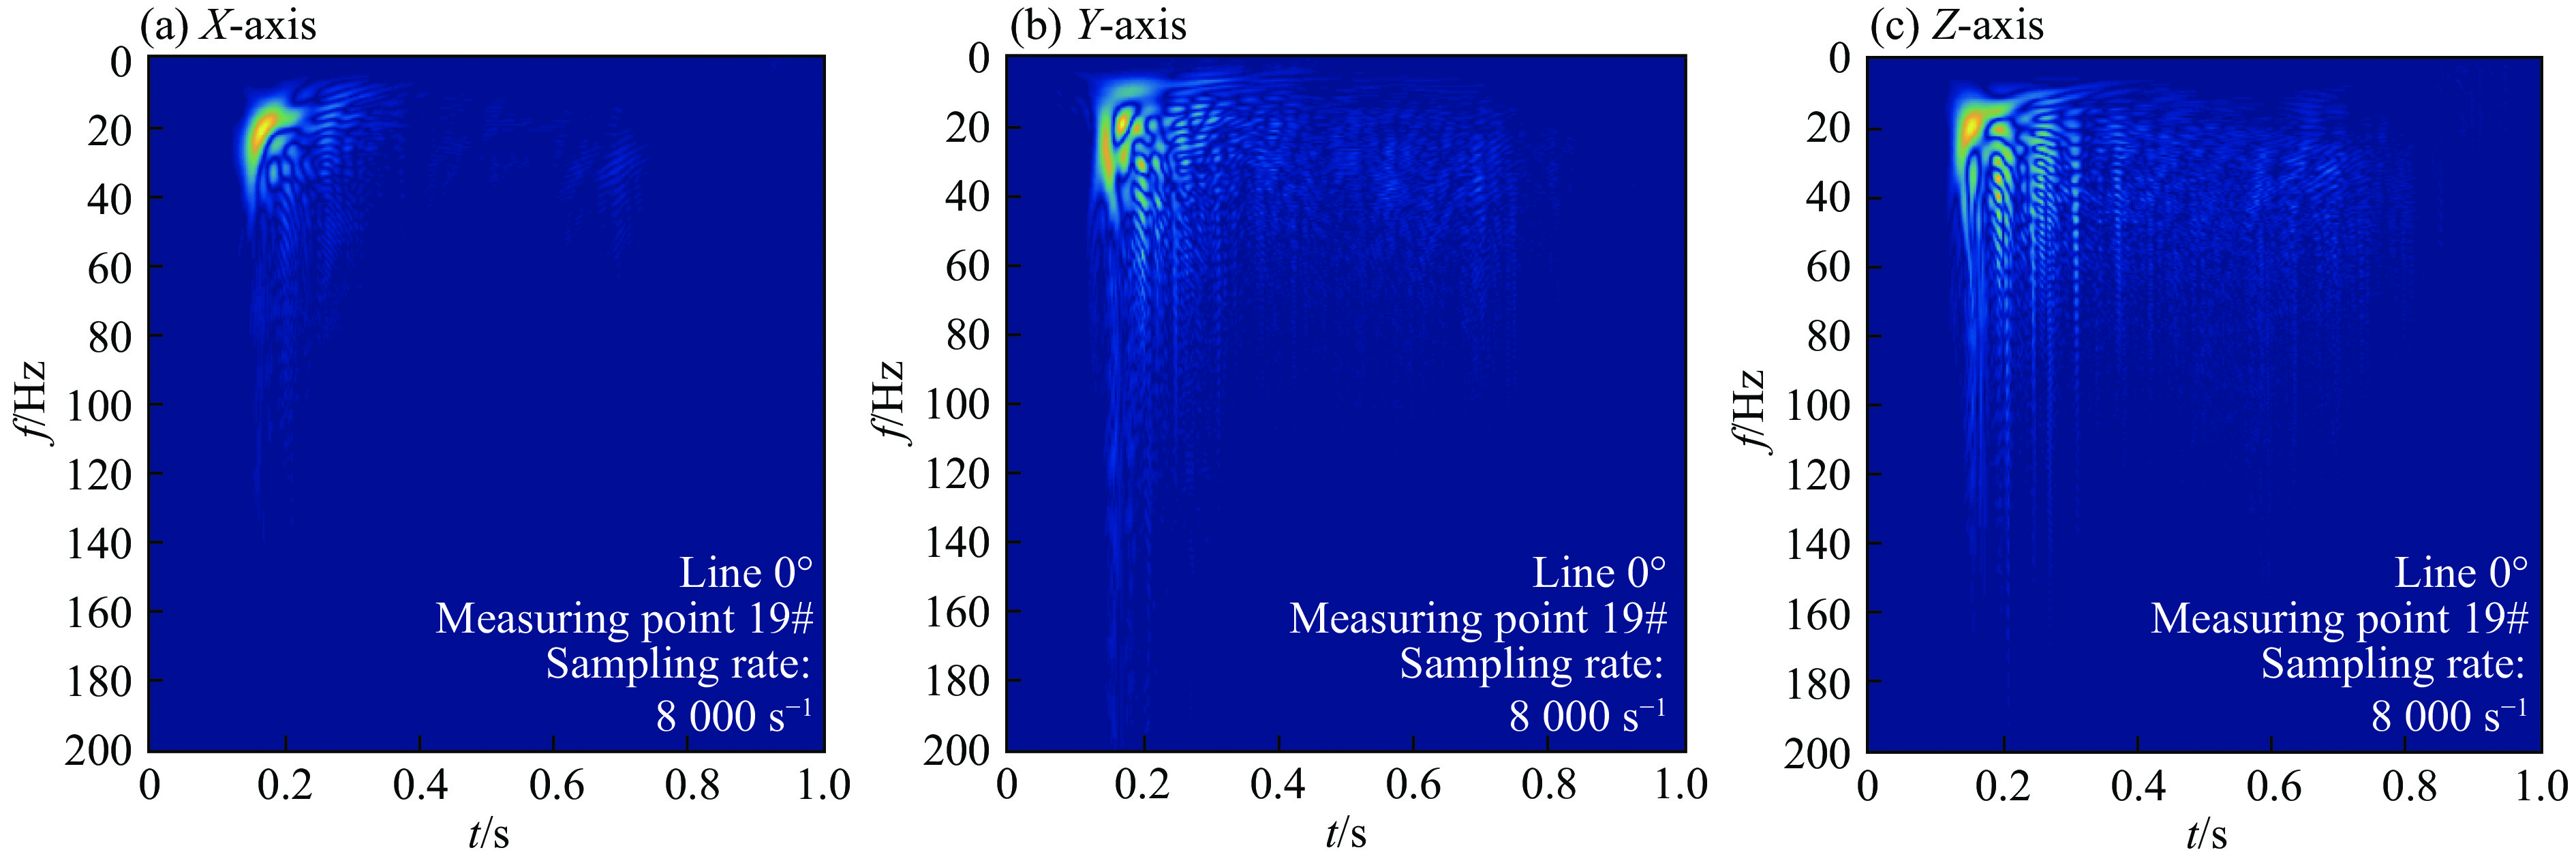
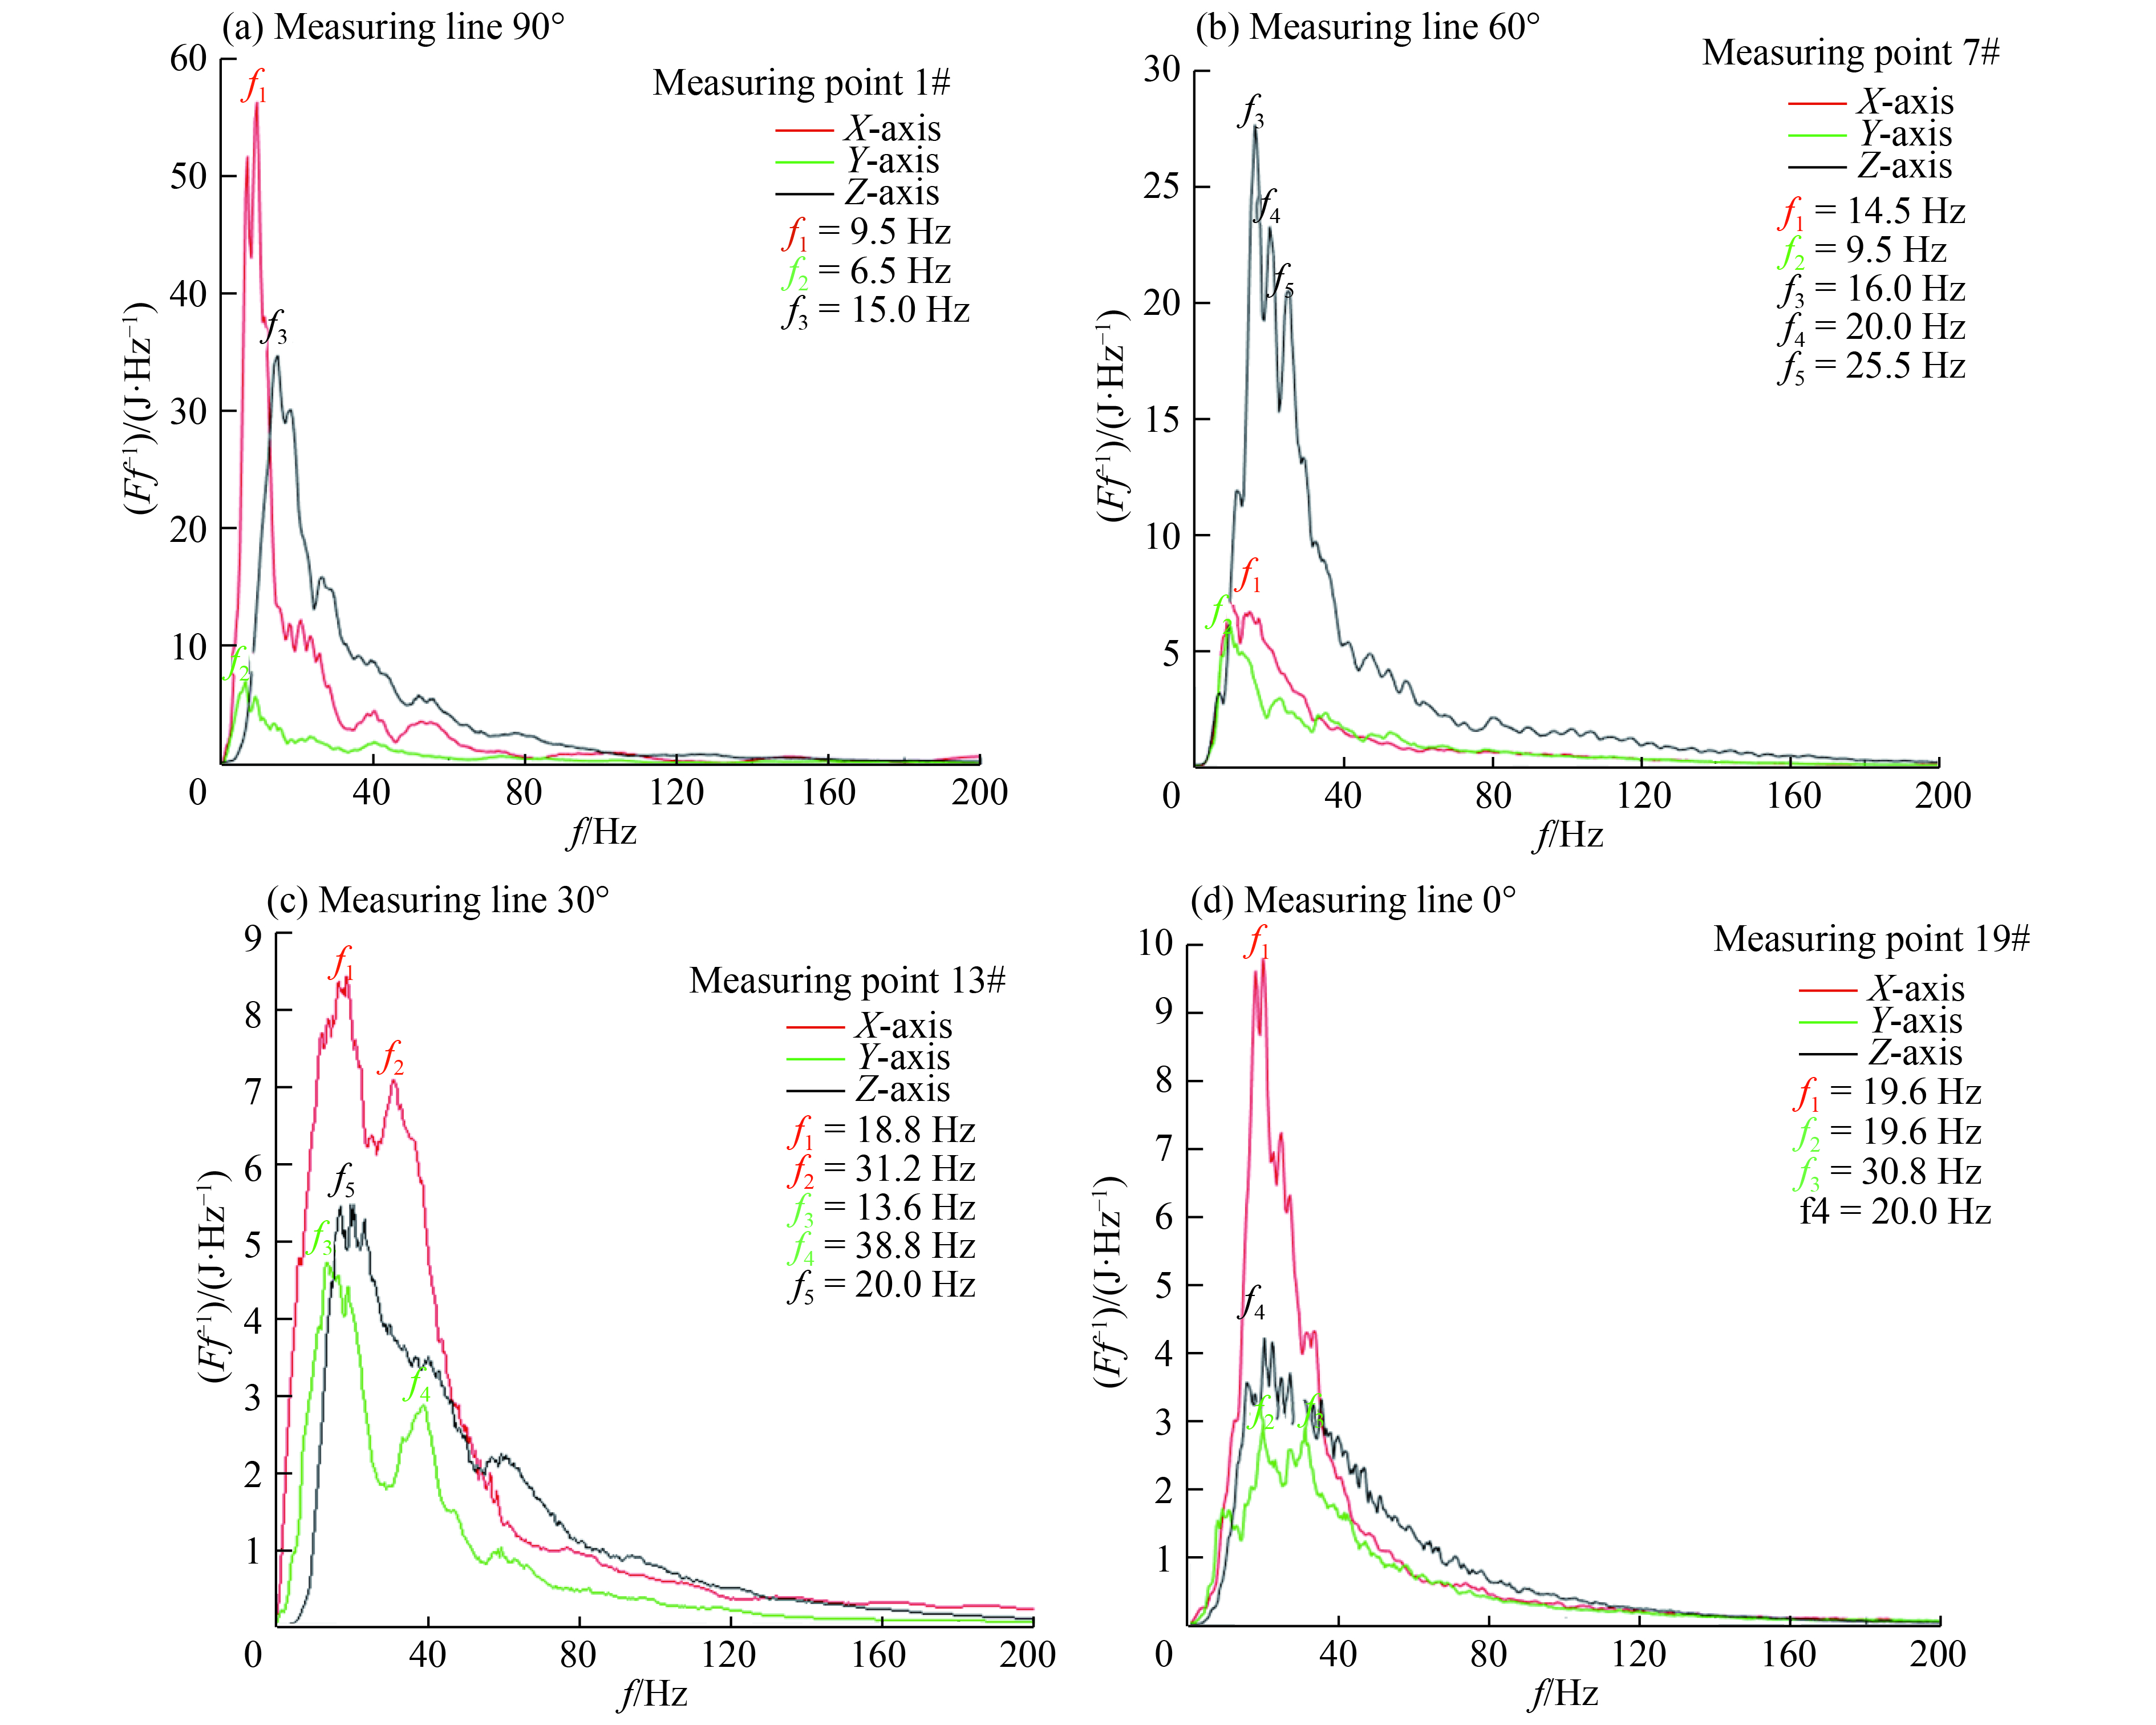
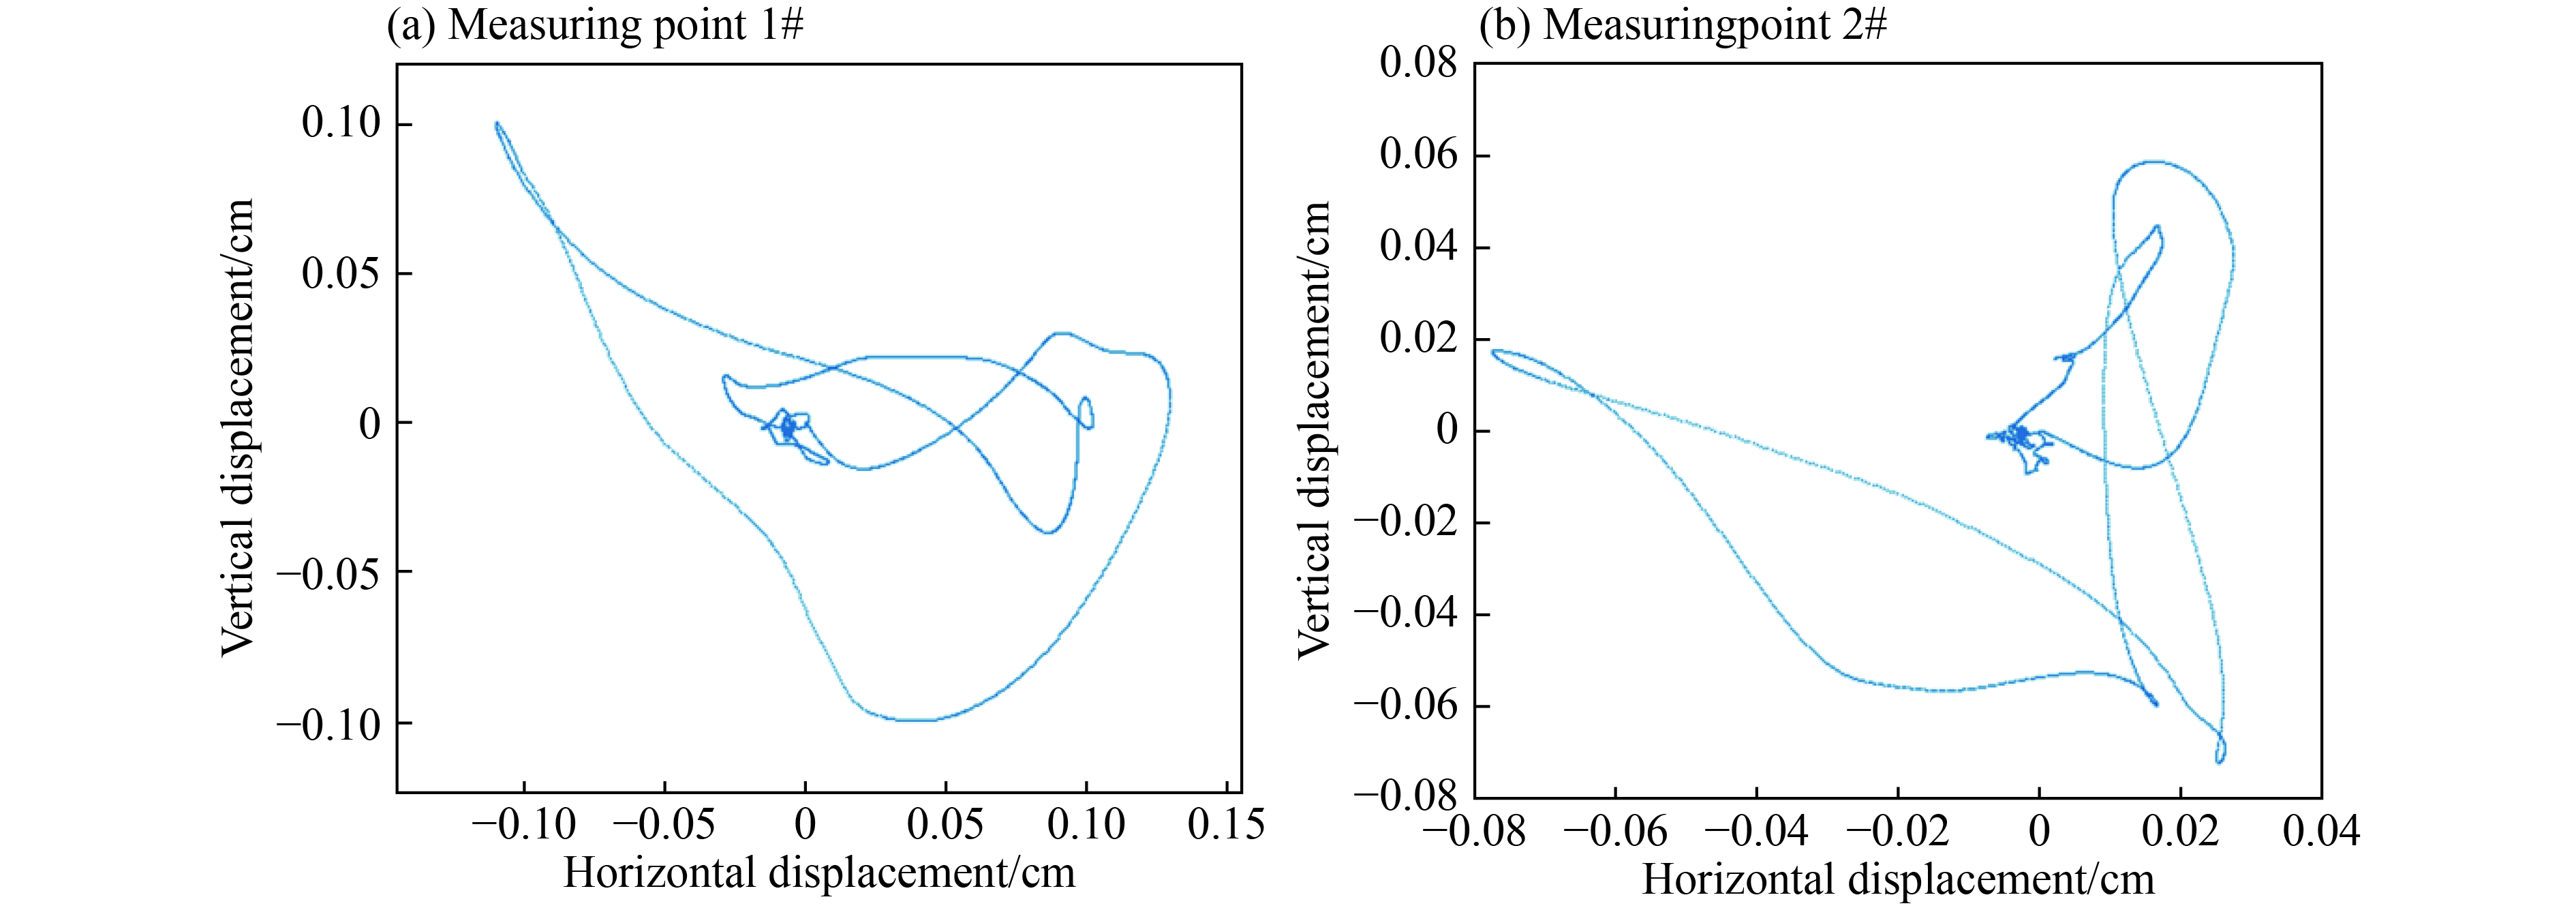
  • 摘要: 针对第三代大输量天然气管道爆炸振动危害效应展开研究,组织实施了全尺寸天然气管道爆炸试验。经数据分析发现,天然气管道爆炸地振动的衰减更加符合指数分布而非传统幂率分布,且其振动强度在空间内分布不均匀,存在特定方向振动加强的现象。采用改进型的MP-WVD算法分析得到天然气管道爆炸地振动的时频特性,其振动的主要频率范围为10~20 Hz,持续时间为0.1~0.2 s。存在多次加载特性,瑞利波成分强于勒夫波成分。研究成果可为后续管道施工安全设计以及事故现场勘测提供参考。
  • 随着世界能源趋向低碳化、无碳化,天然气作为一种高效、清洁的能源已备受青睐。目前,天然气在世界能源结构中已跃居第二位,预计将会超过石油而居第一[1]。尽管高压天然气管道具有高效、经济等特点,但由于近域施工行为、环境腐蚀、机械或材料失效、自然灾害及其他未知因素的影响,天然气管道爆裂事故时有发生(见图1[2-4]

    图  1  天然气管道爆炸事故
    Figure  1.  Pipeline gas explosion accidents

    目前,关于天然气管道爆炸危害效应的研究主要以热辐射和火焰危害为主[5-7]。关于振动的研究大多停留在数值模拟阶段: Su[8]通过建立土层与管道耦合效应的非线性数学模型,对地下管道在复合振动加载模式下的动态响应进行研究,分析了振动对管道的影响,得到评估埋地管道抗震性能的方法;Mahdavi等[9]研究了地下管线在黏性土中的荷载传递特性,分析了管道回填土和沟道宽度的几何效应,得到了土壤强度分布和响应因子。目前尚缺乏对全尺寸干线输气管道爆炸地震波传播规律和时频分布特性的研究,本文中针对高压天然气管道爆炸瞬间物理现象及其产生的振动危害效应展开研究,分析地震波的频谱特性、衰减规律及时频特性。研究成果不仅对并行管道安全设计具有理论指导意义和工程应用价值,同时对管线附近建(构)筑物和重要设施的抗震与防护设计也具有参考作用。

    试验选用第三代大输量天然气管道,该型管道大量应用于西气东输二线工程。管身材料采用X90级别管线钢,弹性模量206 GPa,泊松比0.3,屈服强度715 MPa,直径1 219 mm,壁厚16.3 mm,内压 12 MPa,埋深1.2 m。管道总长约430 m,中间部分是长130 m的试验段,为尽可能地模拟无限长输气管道爆炸时的泄压状态,在试验段两端各设置长150 m的储气段,如图2所示。管内填充天然气,压力12 MPa,气体摩尔分数分别为:x(CH4)=94.91%,x(C2H6)=2.55%,x(CO2)=0.94%,x(N2)=1.4%,x(其他)=0.2%。在试验段中点沿轴线方向,设置长0.5 m的线型聚能切割器,以引入初始裂纹使管道发生爆裂。

    图  2  试验场
    Figure  2.  Test field

    试验测线布设,以起爆点为原点,在与管道轴线分别呈0°、30°、60°和90°的4个方向上设置测线。其中,30°、60°和90°测线上设置6个测点,0°测线上设置5个测点。每个测点处安装振动速度测试仪和振动加速度测试仪各1台。具体布设方案如图3所示,其中60°、30°以及0°测线的测点间距同90°测线。

    图  3  测点布设方案
    Figure  3.  Layout scheme of measuring points

    试验选用TC-4850和Blast-UM型振动测试仪。两型仪器均配备集成式三通道传感器,可同时记录水平径向(X轴)、水平切向(Y轴)和铅垂方向(Z轴)3个方向的振动数据。试验前,所有仪器均在江苏省计量科学研究院进行了校准,以确保数据的真实性。

    起爆瞬间以及爆后管道裂口如图4所示。试验起爆过程为:发射燃烧弹,聚能切割器点火。射流刀穿过管壁形成初始裂缝,管壁在初始裂纹和巨大内压共同作用下裂纹产生扩展。管内高压天然气迅速喷出,气团接触到燃烧弹后被瞬间点燃。起爆后约3 s,气团发生完全爆燃,现场形成巨大蘑菇云,直径达150 m左右。爆炸后无人机传回画面,可看到有残余气体持续燃烧约5 min后熄灭。现场留下长约20 m、宽约5 m的漏斗坑,爆后测得裂口长度为17.43 m。

    图  4  爆炸瞬间及爆后管道
    Figure  4.  Explosions and pipeline affected

    试验得到了各测点数据详细信息,见表14(其中6# 和12# 测点设备未正常触发)。表中,l为距离,VXVYVZXYZ方向最大振动速度,fXfY fZXYZ方向主频,V为矢量和。为研究振动能量的衰减规律以及空间分布特性,选取各测点振动信号的矢量和数据进行深入研究。

    表  4  0° 测线振动速度
    Table  4.  Data of vibration velocity of measuring line 0°
    测点 l/m VX/(cm·s−1) fX/Hz VY/(cm·s−1) fY/Hz VZ/(cm·s−1) fZ/Hz V/(cm·s−1)
    19# 20 7.99 27.5 4.33 29.2 5.03 18.9 9.33
    20# 30 3.13 26.1 3.03 21.3 6.91 18.2 7.34
    21# 40 1.73 22.2 1.63 12.8 4.15 13.6 4.22
    22# 60 1.03 18.2 0.85 18.3 1.13 14.2 1.16
    23# 90 0.78 17.5 0.61 13.6 0.95 13.7 0.54
    下载: 导出CSV 
    | 显示表格
    表  1  90° 测线振动速度
    Table  1.  Data of vibration velocity of measuring line 90°
    测点 l/m VX/(cm·s−1) fX/Hz VY/(cm·s−1) fY/Hz VZ/(cm·s−1) fZ/Hz V/(cm·s−1)
    1# 20 7.14 8.3 6.32 8.2 9.05 15.3 13.15
    2# 30 5.32 8.0 5.15 8.6 7.85 16.2 10.79
    3# 40 2.95 8.1 3.17 58.5 5.39 18.9 7.60
    4# 60 1.44 8.0 2.37 60.4 2.31 15.4 3.57
    5# 90 2.58 7.9 1.85 7.9 3.94 13.8 1.90
    6# 130
    下载: 导出CSV 
    | 显示表格

    图5可以看出,振动峰值的衰减呈现先快后慢的模式,为了进一步研究其衰减规律,分别用指数拟合和幂率拟合对各个测线上的数据进行拟合并对比效果,如图6所示。

    图  6  拟合效果对比
    Figure  6.  Comparison of fitted effects
    图  5  振动峰值分布图
    Figure  5.  Peak vibration distribution diagram

    在文献[10-11]中,爆破地震波的衰减规律遵循幂率分布。然而,由图6的拟合效果对比可以看出,4条测线上数据的指数拟合结果均优于其幂率拟合结果,指数拟合有着更小的拟合误差值(SSE),并且其确定系数(R-square)更接近1。因此,天然气管道爆炸地振动衰减更符合指数分布,本次试验中90°、60°、30°、0°测线上的衰减拟合结果分别为:

    V=24.37e0.02936r(1)
    V=17.91e0.03412r(2)
    V=22.97e0.03149r(3)
    V=22.3e0.04133r(4)

    式中:V为振动速度,单位为cm/s;r为距爆心距离,单位为m。

    图56以及拟合结果可以看出,振动强度和测线角度显著相关。其中,90o测线振动强度最大,之后依次为30°测线、60°测线和0°测线。为了更直观的反应振动强度在地面的分布,首先对采集到的数据在空间内进行两次镜像延拓,然后采用重调和方程对所得数据进行了三维拟合,得到了振动强度在空间内的分布场,效果如图7所示。

    图  7  振动场三维拟合效果图
    Figure  7.  3D fitting diagram of vibration field

    图7中,X轴(Y=0)与管道重合。可以看出,地震波在空间内不呈圆对称分布,这一点与普通集团装药爆炸地震波特性不同。管道爆炸地震波在90°方向和30°方向较强,60°方向和0°方向较弱。这样的分布特性意味着,在讨论天然气管道爆炸地震波损害范围时,不能只考虑距离因素,还需考虑角度因素。

    选用周辉等[12]优化的双参数匹配追踪算法联合WVD分布的时频分解算法。其中WVD分布是由Ville引入信号分析领域的。根据特征函数方法,推导信号X(t)的WVD分布为:

    W(t,ω)=12πx(t12τ)x(t+12τ)ejτωdτ(5)

    WVD拥有极高的时间-频率分辨率,但由于其自身为二次型时频解析,因此不具备线型可加性,严重影响了它在非平稳随机信号分析领域的运用。为解决此问题,将匹配追踪算法引入,其原理是将多成分混杂的原始信号分解为基础子波,分别对子波进行WVD分解,再将所有子波的WVD结果相加,便可得到原始信号的真实WVD分布。另外,选用的双参数匹配追踪算法是结合了Hilbert变换,对原始信号的优势频率和瞬时相位先行确定,从而大大降低了匹配追踪的运算量,为大数据量处理提供了基础。

    将1#、7#、13#和19#测点的振动信号采用改进型MP-WVD算法进行处理,得到其时频分布如图811所示。

    图  8  1#测点振动信号时频分布
    Figure  8.  Time frequency distribution of measuring point 1#
    图  9  7#测点振动信号时频分布
    Figure  9.  Time frequency distribution of measuring point 7#
    图  10  13#测点振动信号时频分布
    Figure  10.  Time frequency distribution of measuring point 13#
    图  11  19#测点振动信号时频分布
    Figure  11.  Time frequency distribution of measuring point 19#

    图811可看出,各个测点振动数据的时频分布呈现一定的规律性:振动能量频率中心都分布在10~20 Hz范围内,振动持续时长约为0.1~0.2 s。同时,X轴振动在时频域内相对集中,而Y轴和Z轴振动在时频域的分布相对比较分散。振动加强区与削弱区的时频特性并没有显著区别。将时频谱对时间轴做积分,得到频率边际谱[13-14],相比于通过傅里叶变换得到的幅频谱,频率边际谱可以更直观地看到各个频率成分在全局上的累加,如图12所示。

    图  12  频率边际谱
    Figure  12.  Marginal spectrum

    图12可以看出,天然气管道爆炸地震波绝大部分能量分布在0~40 Hz频带,40 Hz以上频带所占比重极小。并且代表瑞利波的X轴、Z轴分量明显强于代表勒夫波的Y轴分量,因此可以判断管道爆炸地震波主要以瑞利波形式传播。通过对振动速度信号的滤波和积分得到其质点运动轨迹如图13所示,可以看出明显的瑞利波“椭圆形”轨迹的特征,并且水平方向位移较大。

    图  13  质点位移
    Figure  13.  Particle displacement

    经过试验研究和数据分析,得到了管道外径1 219 mm、内压12 MPa的X90天然气管道爆炸地振动的相关结论。

    (1)天然气管道爆炸地振动衰减符合指数分布,且其在各个方向上的衰减速度有所差异。

    (2)天然气管道爆炸地振动振动强度在空间上呈不均匀分布,在90°和30°方向较强,而在60°和0°方向较弱。因此在做天然气管道爆炸隐患点防护、疏散或者损伤范围估算时,要考虑到角度因素的影响。

    (3)天然气管道爆炸地振动的频率范围为10~20 Hz,加载时间为0.1~0.2 s。其中瑞利波强于勒夫波,因此在管道周边建筑抗震安全设计时应优先考虑对此频率范围的载荷进行预防,并对建筑的水平径向和垂直刚度进行加强。

    表  3  30° 测线振动速度
    Table  3.  Data of vibration velocity of measuring line 30°
    测点 l/m VX/(cm·s−1) fX/Hz VY/(cm·s−1) fY/Hz VZ/(cm·s−1) fZ/Hz V/(cm·s−1)
    13# 20 8.46 15.5 6.96 15.2 6.56 22.9 11.86
    14# 30 3.19 18.1 1.82 23.5 9.46 15.1 9.68
    15# 40 2.54 17.5 0.91 16.7 5.43 20.3 6.52
    16# 60 1.32 20.1 0.99 8.8 2.22 16.1 2.79
    17# 90 0.85 16.6 0.75 18.0 1.40 19.7 1.53
    18# 130 0.36 19.1 0.38 17.3 0.54 17.9 0.65
    下载: 导出CSV 
    | 显示表格
    表  2  60° 测线振动速度
    Table  2.  Data of vibration velocity of measuring line 60°
    测点 l/m VX/(cm·s−1) fX/Hz VY/(cm·s−1) fY/Hz VZ/(cm·s−1) fZ/Hz V/(cm·s−1)
    7# −20 5.37 8.0 4.58 61.2 8.77 13.7 9.01
    8# −30 4.33 17.7 3.71 60.6 7.92 14.0 6.31
    9# −40 4.76 16.8 2.41 16.0 2.41 13.8 5.17
    10# −60 1.35 13.5 1.09 7.9 0.81 20.2 1.50
    11# −90 1.00 12.0 0.74 8.3 1.08 16.8 1.32
    12# 130
    下载: 导出CSV 
    | 显示表格
  • 图  1  天然气管道爆炸事故

    Figure  1.  Pipeline gas explosion accidents

    图  2  试验场

    Figure  2.  Test field

    图  3  测点布设方案

    Figure  3.  Layout scheme of measuring points

    图  4  爆炸瞬间及爆后管道

    Figure  4.  Explosions and pipeline affected

    图  6  拟合效果对比

    Figure  6.  Comparison of fitted effects

    图  5  振动峰值分布图

    Figure  5.  Peak vibration distribution diagram

    图  7  振动场三维拟合效果图

    Figure  7.  3D fitting diagram of vibration field

    图  8  1#测点振动信号时频分布

    Figure  8.  Time frequency distribution of measuring point 1#

    图  9  7#测点振动信号时频分布

    Figure  9.  Time frequency distribution of measuring point 7#

    图  10  13#测点振动信号时频分布

    Figure  10.  Time frequency distribution of measuring point 13#

    图  11  19#测点振动信号时频分布

    Figure  11.  Time frequency distribution of measuring point 19#

    图  12  频率边际谱

    Figure  12.  Marginal spectrum

    图  13  质点位移

    Figure  13.  Particle displacement

    表  4  0° 测线振动速度

    Table  4.   Data of vibration velocity of measuring line 0°

    测点 l/m VX/(cm·s−1) fX/Hz VY/(cm·s−1) fY/Hz VZ/(cm·s−1) fZ/Hz V/(cm·s−1)
    19# 20 7.99 27.5 4.33 29.2 5.03 18.9 9.33
    20# 30 3.13 26.1 3.03 21.3 6.91 18.2 7.34
    21# 40 1.73 22.2 1.63 12.8 4.15 13.6 4.22
    22# 60 1.03 18.2 0.85 18.3 1.13 14.2 1.16
    23# 90 0.78 17.5 0.61 13.6 0.95 13.7 0.54
    下载: 导出CSV

    表  1  90° 测线振动速度

    Table  1.   Data of vibration velocity of measuring line 90°

    测点 l/m VX/(cm·s−1) fX/Hz VY/(cm·s−1) fY/Hz VZ/(cm·s−1) fZ/Hz V/(cm·s−1)
    1# 20 7.14 8.3 6.32 8.2 9.05 15.3 13.15
    2# 30 5.32 8.0 5.15 8.6 7.85 16.2 10.79
    3# 40 2.95 8.1 3.17 58.5 5.39 18.9 7.60
    4# 60 1.44 8.0 2.37 60.4 2.31 15.4 3.57
    5# 90 2.58 7.9 1.85 7.9 3.94 13.8 1.90
    6# 130
    下载: 导出CSV

    表  3  30° 测线振动速度

    Table  3.   Data of vibration velocity of measuring line 30°

    测点 l/m VX/(cm·s−1) fX/Hz VY/(cm·s−1) fY/Hz VZ/(cm·s−1) fZ/Hz V/(cm·s−1)
    13# 20 8.46 15.5 6.96 15.2 6.56 22.9 11.86
    14# 30 3.19 18.1 1.82 23.5 9.46 15.1 9.68
    15# 40 2.54 17.5 0.91 16.7 5.43 20.3 6.52
    16# 60 1.32 20.1 0.99 8.8 2.22 16.1 2.79
    17# 90 0.85 16.6 0.75 18.0 1.40 19.7 1.53
    18# 130 0.36 19.1 0.38 17.3 0.54 17.9 0.65
    下载: 导出CSV

    表  2  60° 测线振动速度

    Table  2.   Data of vibration velocity of measuring line 60°

    测点 l/m VX/(cm·s−1) fX/Hz VY/(cm·s−1) fY/Hz VZ/(cm·s−1) fZ/Hz V/(cm·s−1)
    7# −20 5.37 8.0 4.58 61.2 8.77 13.7 9.01
    8# −30 4.33 17.7 3.71 60.6 7.92 14.0 6.31
    9# −40 4.76 16.8 2.41 16.0 2.41 13.8 5.17
    10# −60 1.35 13.5 1.09 7.9 0.81 20.2 1.50
    11# −90 1.00 12.0 0.74 8.3 1.08 16.8 1.32
    12# 130
    下载: 导出CSV
  • [1] 范照伟. 全球天然气发展格局及我国天然气发展方向分析 [J]. 中国矿业, 2018, 27(4): 11–16; 22

    FAN Zhaowei. Global natural gas development pattern and the analysis of development direction of natural gas in China [J]. China Mining Magazine, 2018, 27(4): 11–16; 22
    [2] 帅健. 美国油气管道事故及其启示 [J]. 油气储运, 2010, 29(11): 806–809. DOI: 10.6047/j.issn.1000-8241.2010.11.002

    SHUAI Jian. Oil and gas pipeline accident in the United States and its enlightenment [J]. Oil and Gas Storage and Transportation, 2010, 29(11): 806–809. DOI: 10.6047/j.issn.1000-8241.2010.11.002
    [3] 胡灯明, 骆晖. 国内外天然气管道事故分析 [J]. 石油工业技术监督, 2009(9): 8–12. DOI: 10.3969/j.issn.1004-1346.2009.09.002

    HU Dengming, LUO Hui. Case analysis of oil and gas pipeline accidents at home and abroad [J]. Technology Supervision in Petroleum Industry, 2009(9): 8–12. DOI: 10.3969/j.issn.1004-1346.2009.09.002
    [4] YANG S, FANG Q, ZHANG Y, et al. An integrated quantitative hazard analysis method for natural gas jet release from underground gas storage caverns in salt rock. Ⅰ: Models and validation [J]. Journal of Loss Prevention in the Process Industries, 2013, 26(1): 74–81. doi: 10.1016/j.jlp.2012.09.008
    [5] LOWESMITH B J, HANKINSON G. Large scale experiments to study fires following the rupture of high pressure pipelines conveying natural gas and natural gas/hydrogen mixtures [J]. Process Safety and Environmental Protection, 2013, 91(1): 101–111.
    [6] BARALDI D, KOTCHOURKO A, LELYAKIN A, et al. An inter-comparison exercise on CFD model capabilities to simulate hydrogen deflagrations in a tunnel [J]. International Journal of Hydrogen Energy, 2009, 34(18): 7862–7872. doi: 10.1016/j.ijhydene.2009.06.055
    [7] GALLEGO E, MIGOYA E, MARTIN-VALDEPENAS J M, et al. An intercomparison exercise on the capabilities of CFD models to predict distribution and mixing of H2 in a closed vessel [J]. International Journal of Hydrogen Energy, 2007, 32(13): 2235–2245. doi: 10.1016/j.ijhydene.2007.04.009
    [8] SU Huayou. Analysis of characteristics of compound vibration and effects to surrounding gas pipeline caused by impact and explosion [J]. Procedia Engineering, 2011, 26: 1835-1843.
    [9] MAHDAVI H, KENNY S, PHILLIPS R, et al. Influence of geotechnical loads on local buckling behavior of buried pipelines [C]//2008 7th International Pipeline Conference. American Society of Mechanical Engineers, 2008: 543–551.
    [10] 李洪涛, 卢文波, 舒大强, 等. 爆破地震波的能量衰减规律研究 [J]. 岩石力学与工程学报, 2010, 29(S1): 3364–3369

    LI Hongtao, LU Wenbo, SHU Daqiang, et al. Study of energy attenuation law of blast-induced seismic wave [J]. Chinese Journal of Rock Mechanics and Engineering, 2010, 29(S1): 3364–3369
    [11] 吕涛, 石永强, 黄诚, 等. 非线性回归法求解爆破振动速度衰减公式参数 [J]. 岩土力学, 2007(9): 1871–1878. DOI: 10.3969/j.issn.1000-7598.2007.09.019

    LYU Tao, SHI Yongqiang, HUANG Cheng, et al. Study on attenuation parameters of blasting vibrationby nonlinear regression analysis [J]. Rock and Soil Mechanics, 2007(9): 1871–1878. DOI: 10.3969/j.issn.1000-7598.2007.09.019
    [12] 周辉, 龙源, 钟明寿, 等. 基于双参数MP算法的不同孔深爆炸地震波特性研究 [J]. 振动与冲击, 2016, 35(18): 76–81. DOI: 10.13465/j.cnki.jvs.2016.18.013

    ZHOU Hui, LONG Yuan, ZHONG Mingshou, et al. Characteristics analysis of explosion seismic waves with different hole depth based on the method of double parameters matching pursuit [J]. Journal of Vibration and Shock, 2016, 35(18): 76–81. DOI: 10.13465/j.cnki.jvs.2016.18.013
    [13] 闫孔明, 刘飞成, 朱崇浩, 等. 地震作用下含倾斜软弱夹层斜坡场地的动力响应特性研究 [J]. 岩石力学与工程学报, 2017, 36(11): 2686–2698

    YAN Kongming, LIU Feicheng, ZHU Chonghao, et al. Dynamic responses of slopes with intercalated soft layers under seismic excitations [J]. Chinese Journal of Rock Mechanics and Engineering, 2017, 36(11): 2686–2698
    [14] 梅比, 汪旭光, 杨仁树. 基于改进MP-WVD算法的核电厂建设爆破振动信号处理方法[J]. 爆炸与冲击, 2019, 39(4): 045201. DOI: 10.11883/bzycj-2018-0055.

    MEI Bi, WANG Xuguang, YANG Renshu. Blasting vibration signal analysis technology of construction of nuclear power plant based on improved MP-WVD algorithm [J]. Explosion and Shock Waves, 2019, 39(4): 045201. DOI: 10.11883/bzycj-2018-0055.
  • 期刊类型引用(1)

    1. 陈明仙,郭进,罗飞云,王金贵. 点火位置对甲烷-空气预混泄爆容器结构响应影响研究. 西安科技大学学报. 2021(05): 800-807 . 百度学术

    其他类型引用(4)

  • 加载中
图(13) / 表(4)
计量
  • 文章访问数:  5490
  • HTML全文浏览量:  1782
  • PDF下载量:  52
  • 被引次数: 5
出版历程
  • 收稿日期:  2018-04-13
  • 修回日期:  2018-06-01
  • 网络出版日期:  2019-04-25
  • 刊出日期:  2019-04-01

目录

/

返回文章
返回