


A method of geometry optimization for dynamic tensile specimen based on artificial neural network and genetic algorithm
-
摘要: 材料动态拉伸力学性能测试中,动态拉伸试样的几何尺寸对测试结果的准确性与有效性有着较大影响。为对动态拉伸试样的结构进行优化设计,以使其在动态拉伸过程中更好地满足一维应力与变形均匀等基本假设。首先,建立了量化的试样测量准确度指标,即应力平衡达到时间、变形均匀度、非轴向应力相对水平、过渡段相对变形。然后,对试样结构参数进行正交试验设计,通过数值模拟的方法得到了关于试样尺寸与测量准确度指标的正交试验数据库,并对正交试验数据库进行多目标正交试验矩阵分析,得到了试样结构参数对各测量准确度指标影响的主次顺序和规律。最后,以正交试验数据库为训练集,采用人工神经网络(artificial neural network, ANN)协同遗传算法(genetic algorithm, GA)的全局寻优方法对试样的结构尺寸进行优化设计,得到了试样的最优结构尺寸,并对最优尺寸的有效性进行了验证。结果表明,优化后的试样结构在材料动态拉伸力学性能测试精度上的表现明显得以提升。因此,采用ANN-GA协同优化的方法对动态拉伸试样的结构进行优化具有可行性和有效性。Abstract: The split Hopkinson tensile bar is one of the most commonly used apparatuses to test the dynamic tensile mechanical properties of materials at the high strain rates from 102 s−1 to 103 s−1, in which the specimens with a dog-bone shape are usually used. The dimensions of the specimen used are critical to ensure the basic assumptions during dynamic tensile process, such as one-dimensional stress state and uniform deformation of the specimen etc. And whether these assumptions can be satisfied would affect the measurement accuracy of the dynamic tensile properties directly. So, it is urgent to study the influence of the specimen structural parameters on the stress and deformation states of the specimen during the dynamic tensile tests. At the same time, developing and establishing an effective method which can realize the global optimization of specimen structural parameters in the entire parameter space is crucial. In order to actualize the above research objectives, indicators which can quantify the measurement accuracy of the dynamic tensile tests were firstly proposed, namely the time required to reach the stress equilibrium, the deformation uniformity, the relative level of the non-axial stress, and the relative deformation of the transition zones. Orthogonal tests with 6 factors and 5 levels were then designed for the important structural parameters of the dog-bone shaped sheet tensile specimens. According to the rules of the orthogonal test design, 25 dynamic tensile specimens with different structural dimensions were obtained. The commercial finite element software ABAQUS/Explicit was used to establish a finite element model of the split Hopkinson tensile bar, and dynamic tensile test simulations were performed on the dynamic tensile specimens obtained from the orthogonal test design. An orthogonal test dataset with the specimen structural parameters as the input and the measurement accuracy indicators as the output was then constructed. Multi-objective orthogonal test matrix analysis was carried out on the orthogonal test dataset to obtain the influence order as well as the influence law of the structural parameters of the tensile specimens on the measurement accuracy indicators of tests. Taking the orthogonal test dataset as the training dataset, an artificial neural network (ANN) model was used to fit the nonlinear relationship which can predict the measurement accuracy indicators of the test by using the structural parameters of the specimen, and then the fitness function in the genetic algorithm (GA) was established by using this model. Finally, the structural parameters of the dynamic tensile specimen were optimized using the ANN-GA collaborative optimization method, and the optimal structural dimensions of the dynamic tensile specimen were obtained as the result of the optimization. Finite element simulation results show that the optimal structural dimensions obtained by the ANN-GA optimization method are valid. The results of this study demonstrate the practicability and effectiveness of the ANN-GA method in the structural optimization of dynamic tensile specimens. On the other hand, it can provide guidance for the specimen design in the dynamic tensile mechanical properties tests of materials, and can also provide a reference for the validity analysis of the experimentally measured mechanical properties.
-
Key words:
- split Hopkinson bar /
- geometry effect /
- specimen design /
- machine learning /
- genetic algorithm
-
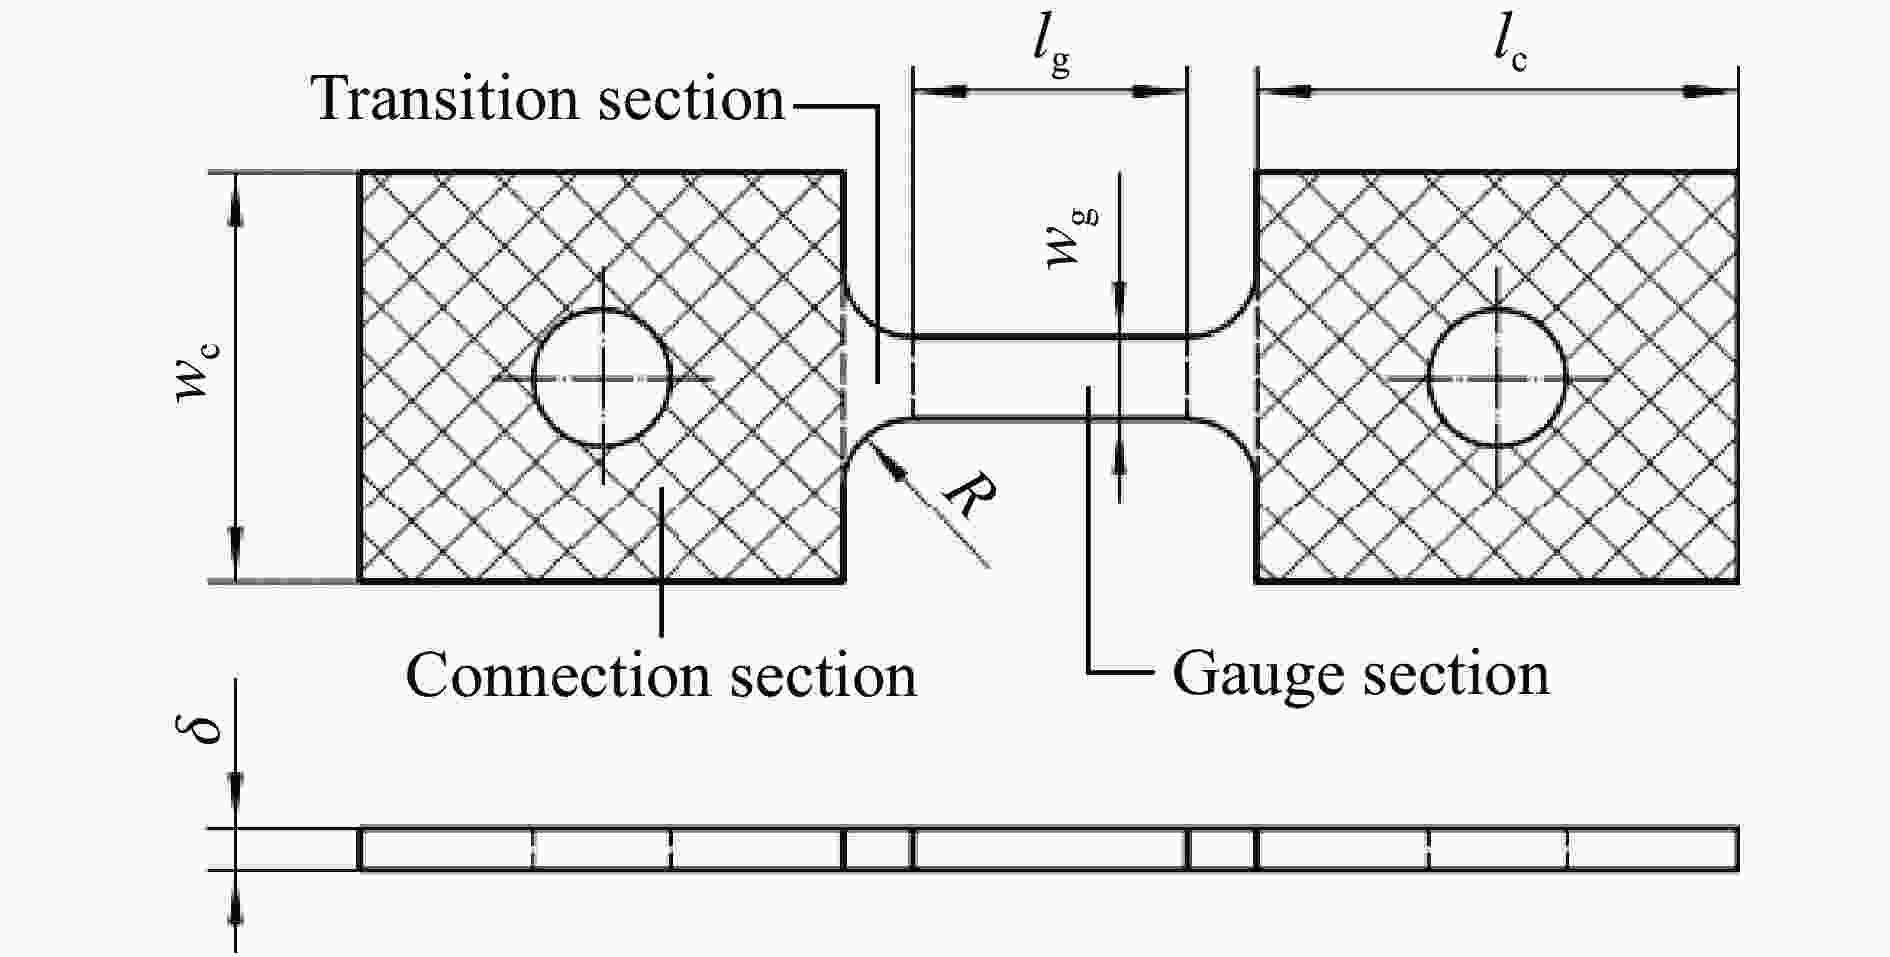
图 2 基于销钉连接的拉伸试样结构
Figure 2. The structure of tensile specimens based on the pin connection
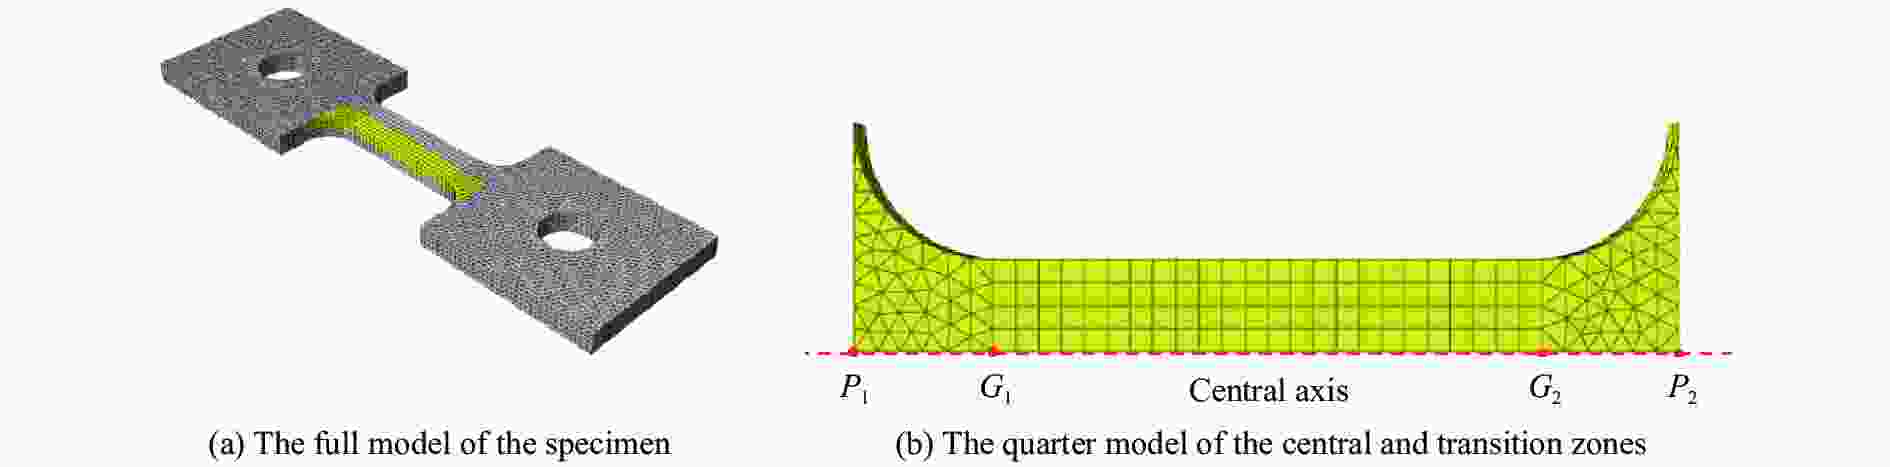
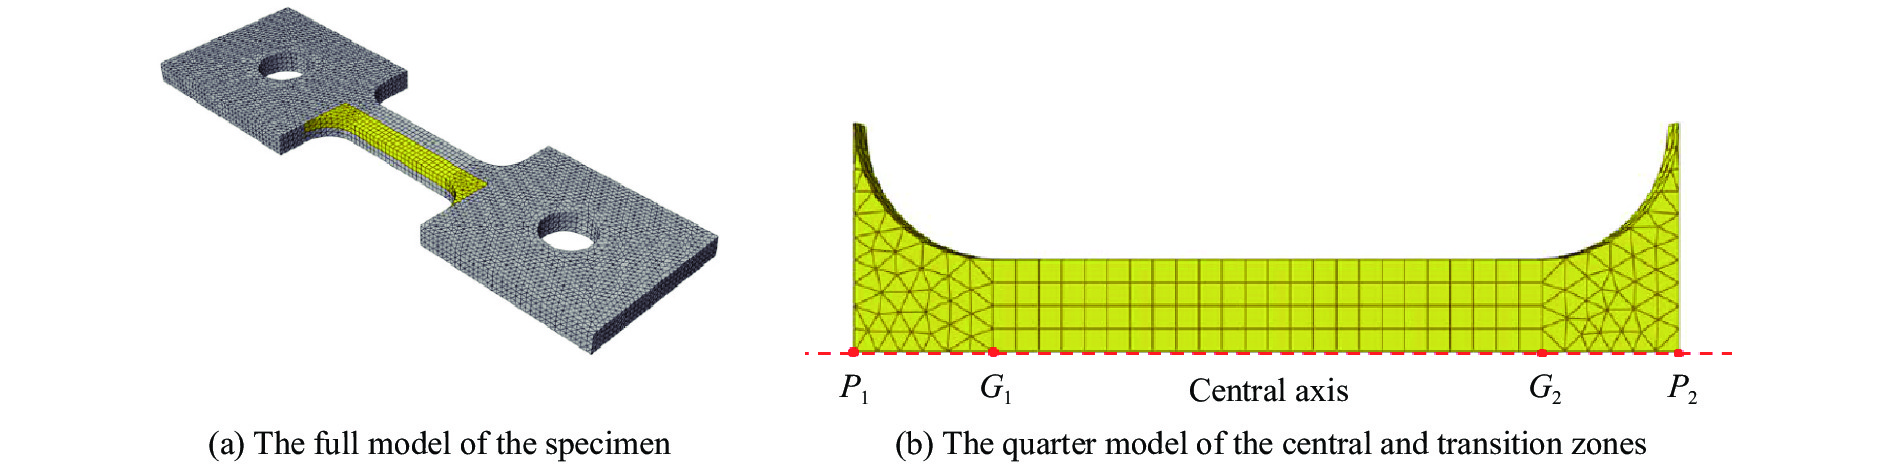
图 3 销钉连接拉伸试样的有限元模型
Figure 3. The finite element models of the pin-connected tensile specimen
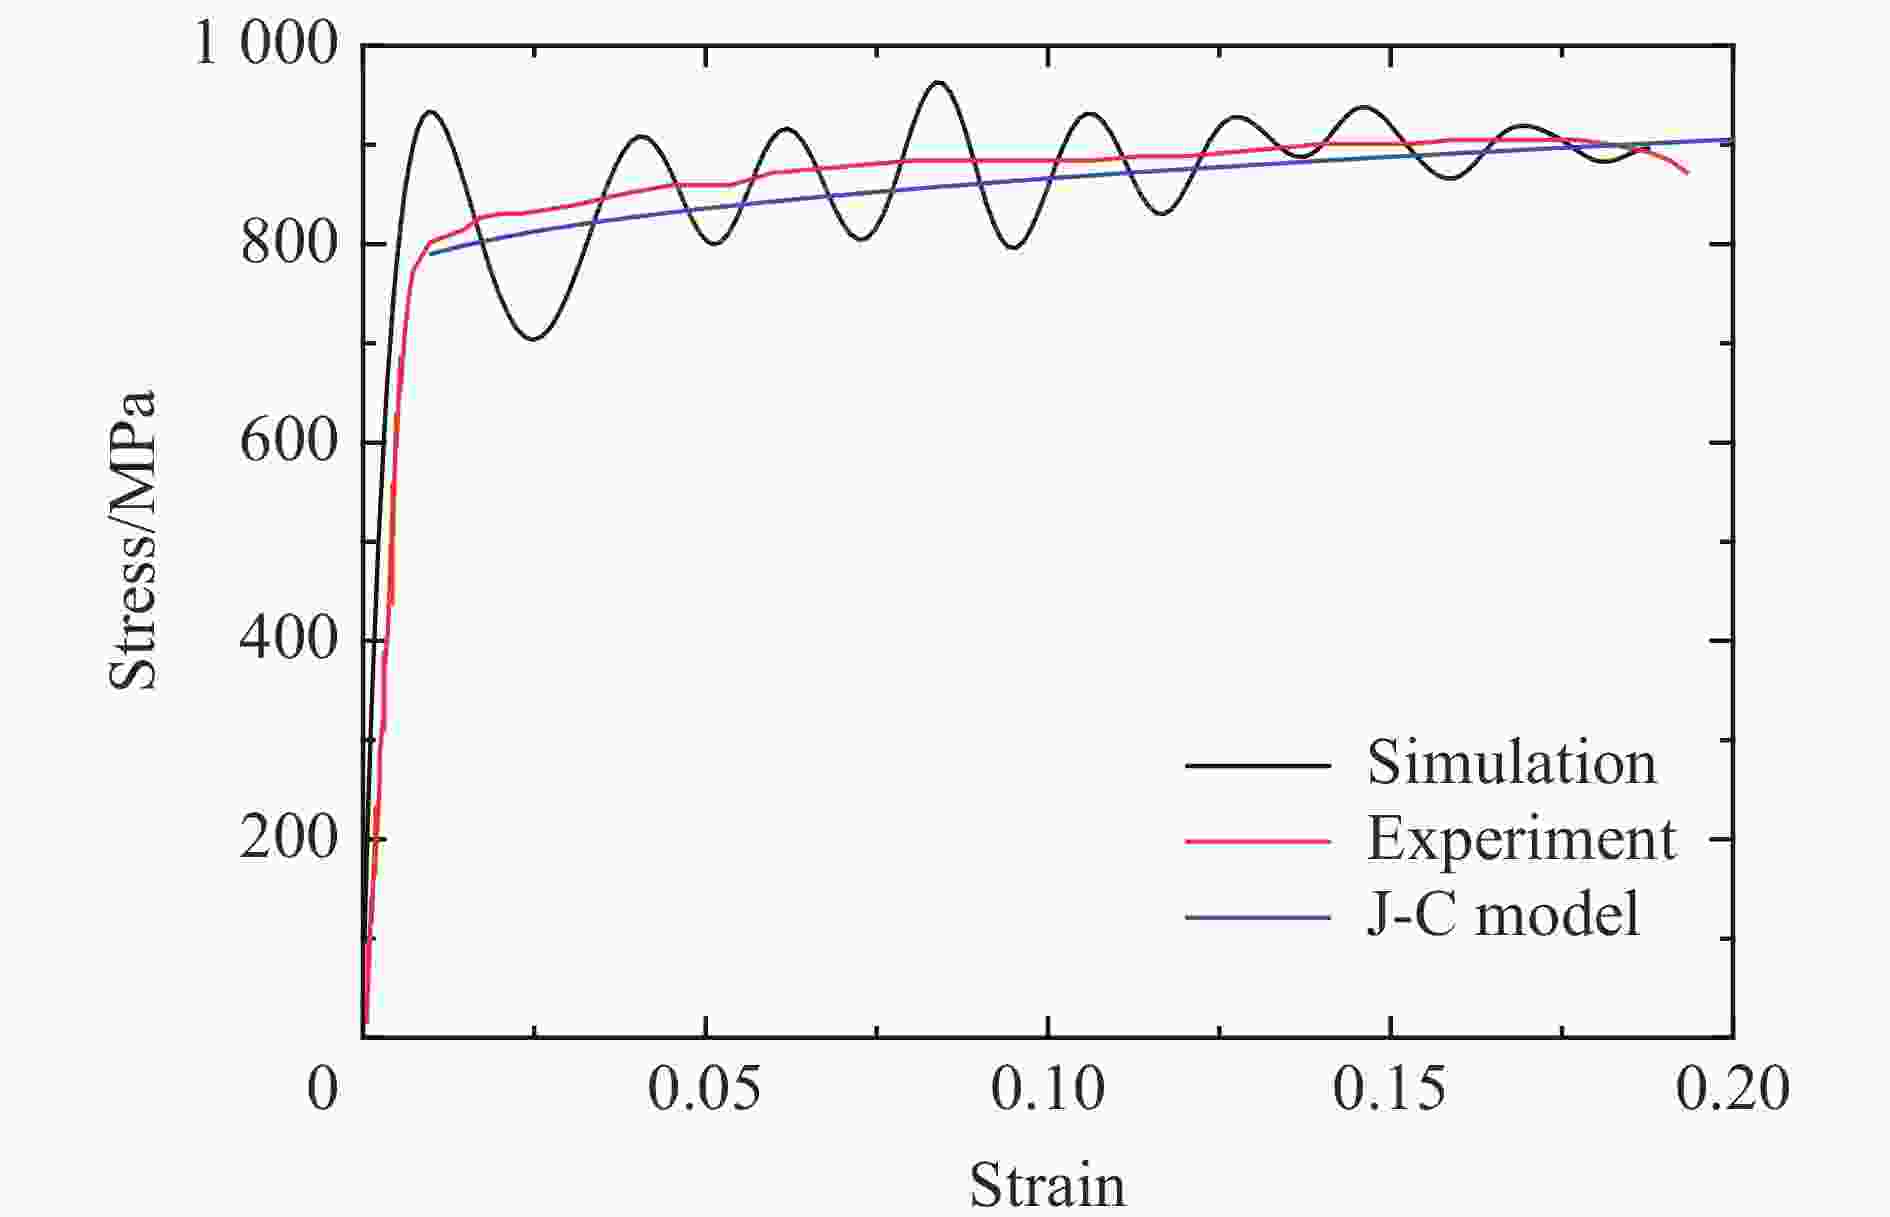
图 5 材料动态拉伸力学性能的数值模拟、实验以及模型对比
Figure 5. Comparison of the dynamic tensile mechanical properties from simulation, experiment and material model
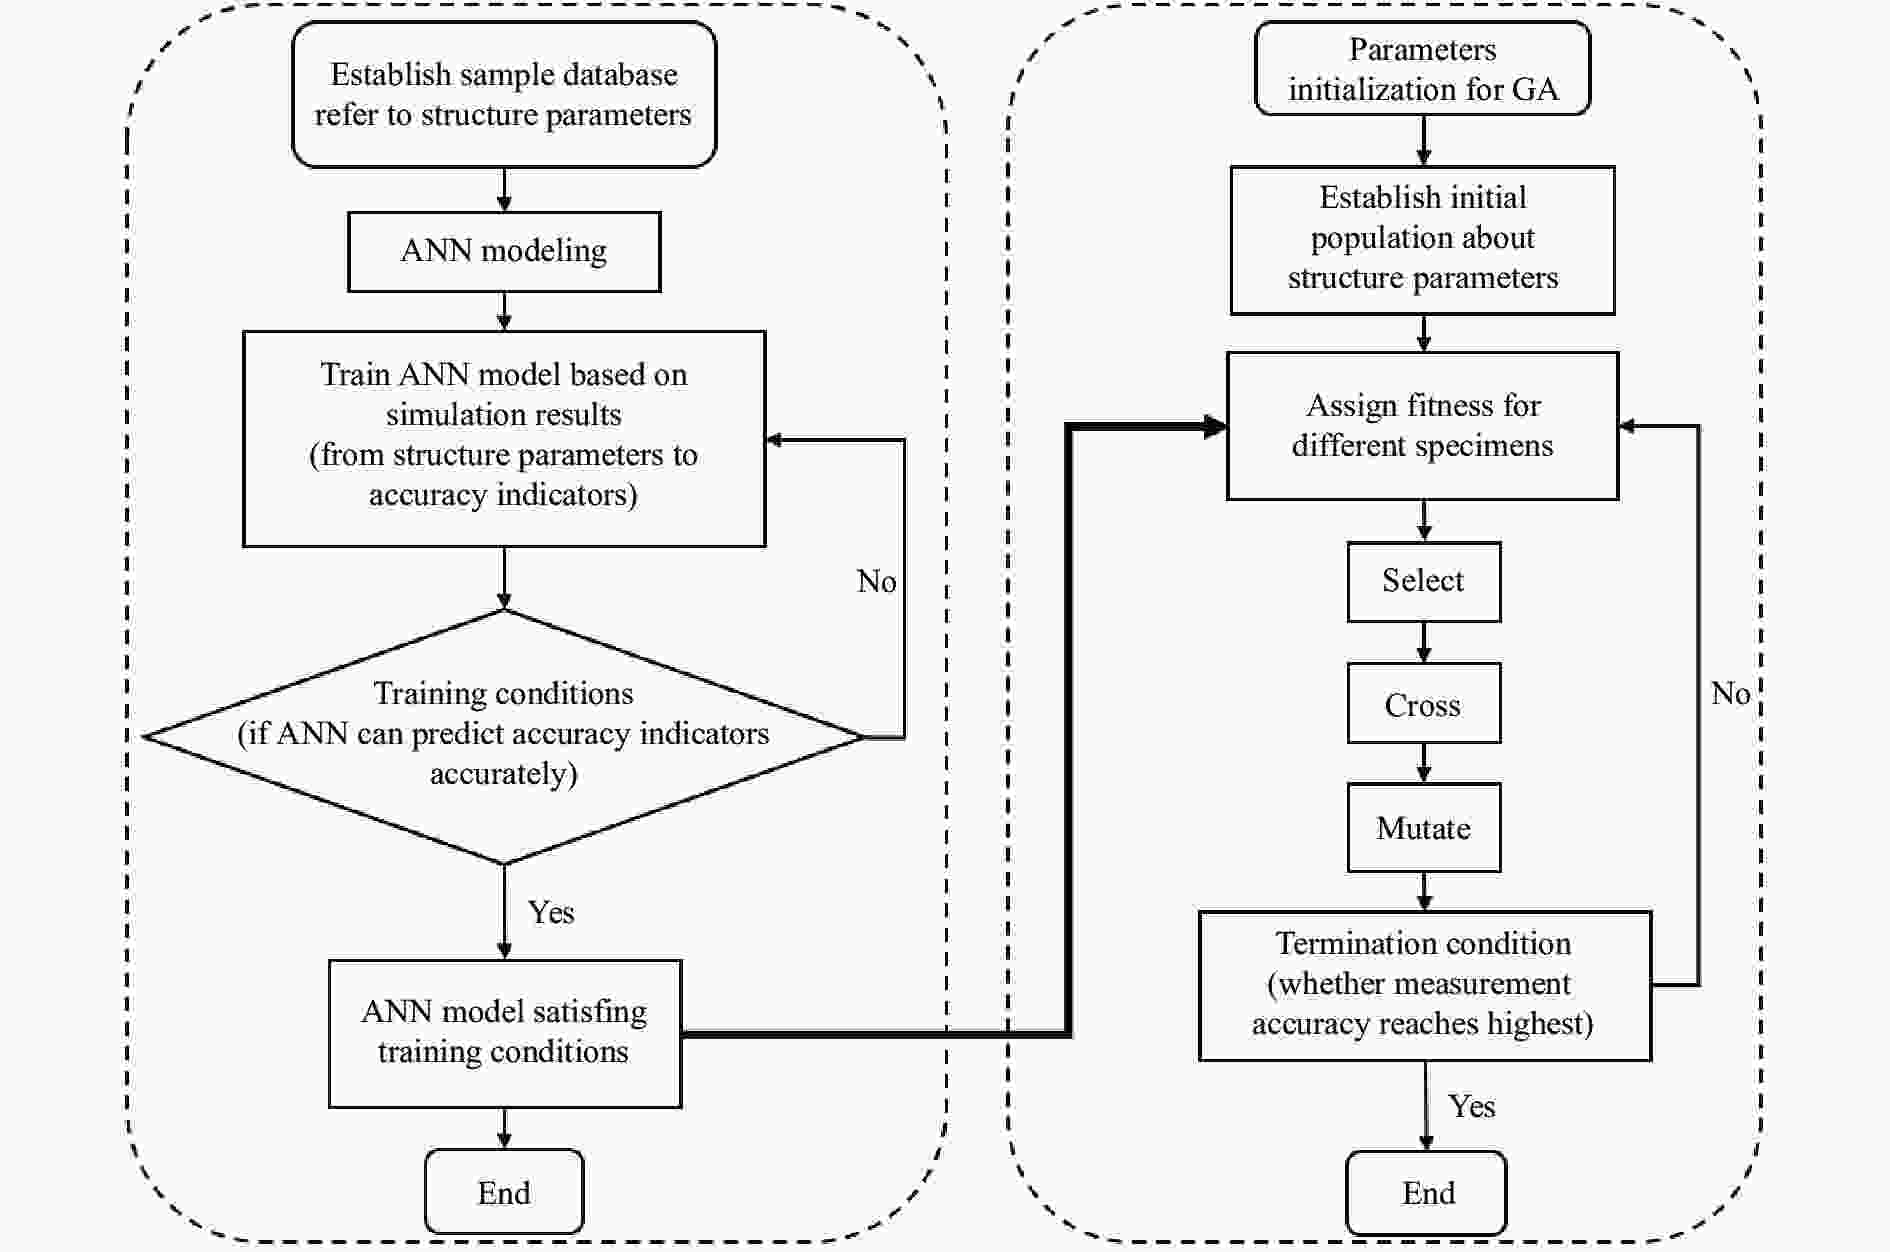
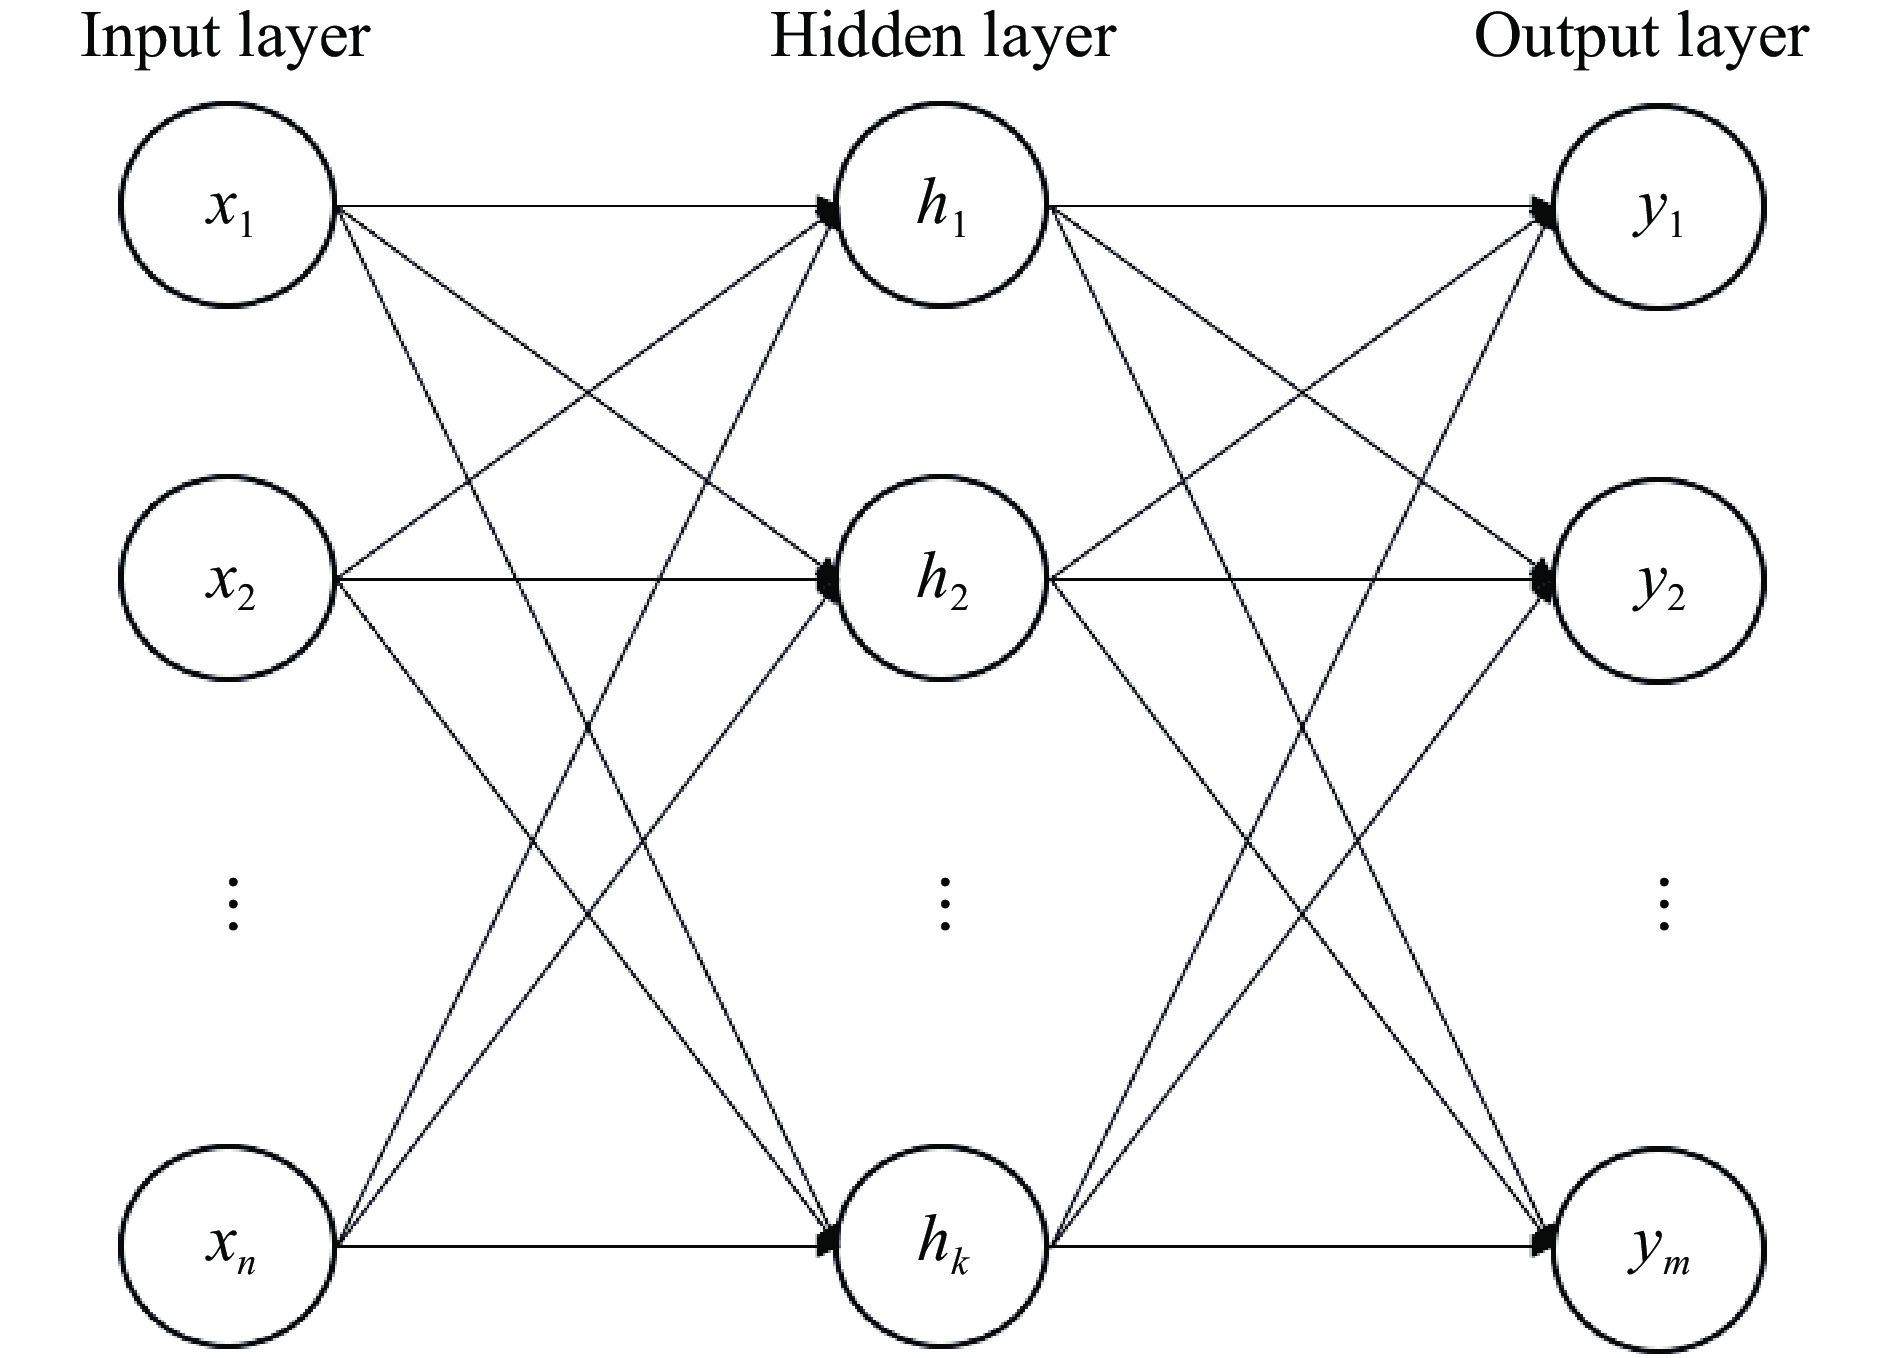
图 8 神经网络与遗传算法协同优化方案
Figure 8. Collaborative optimization scheme of neural network and genetic algorithm
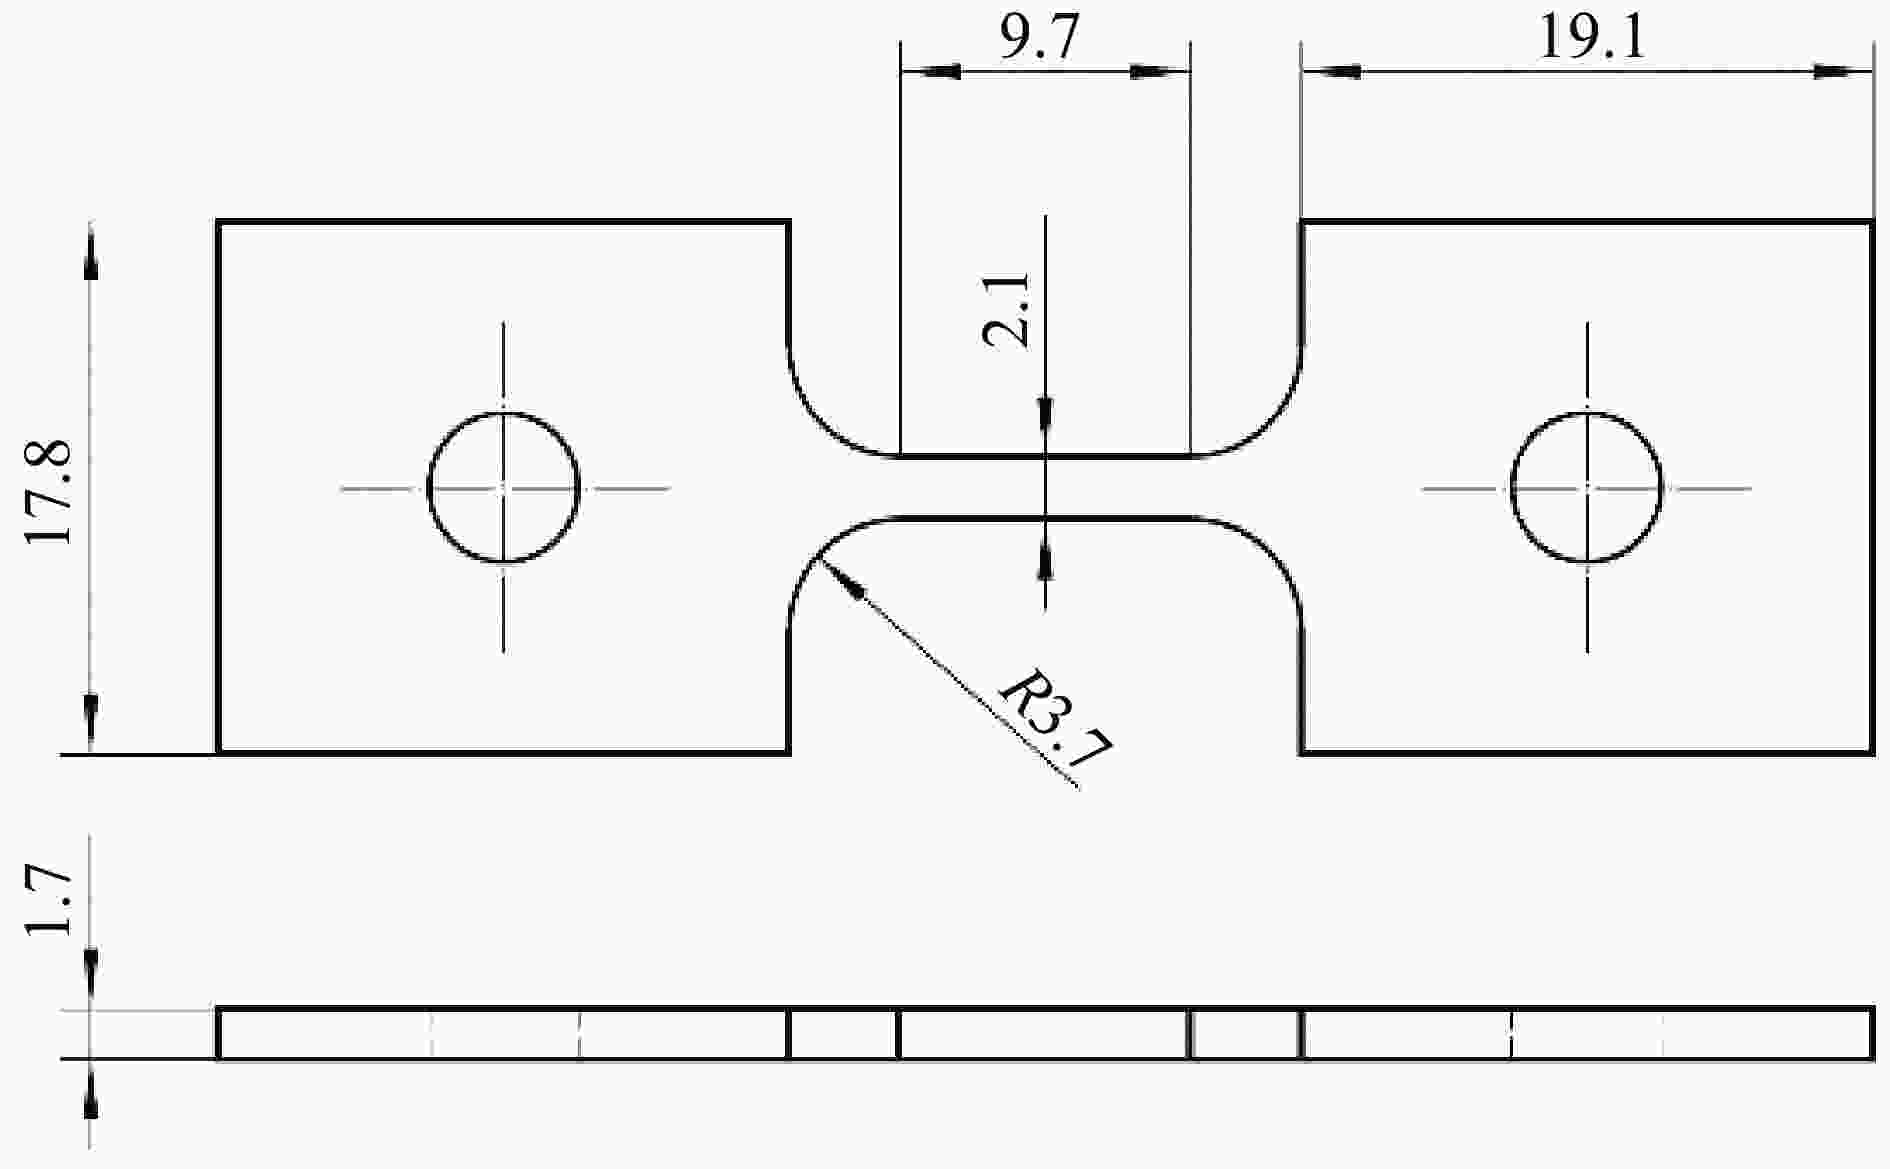
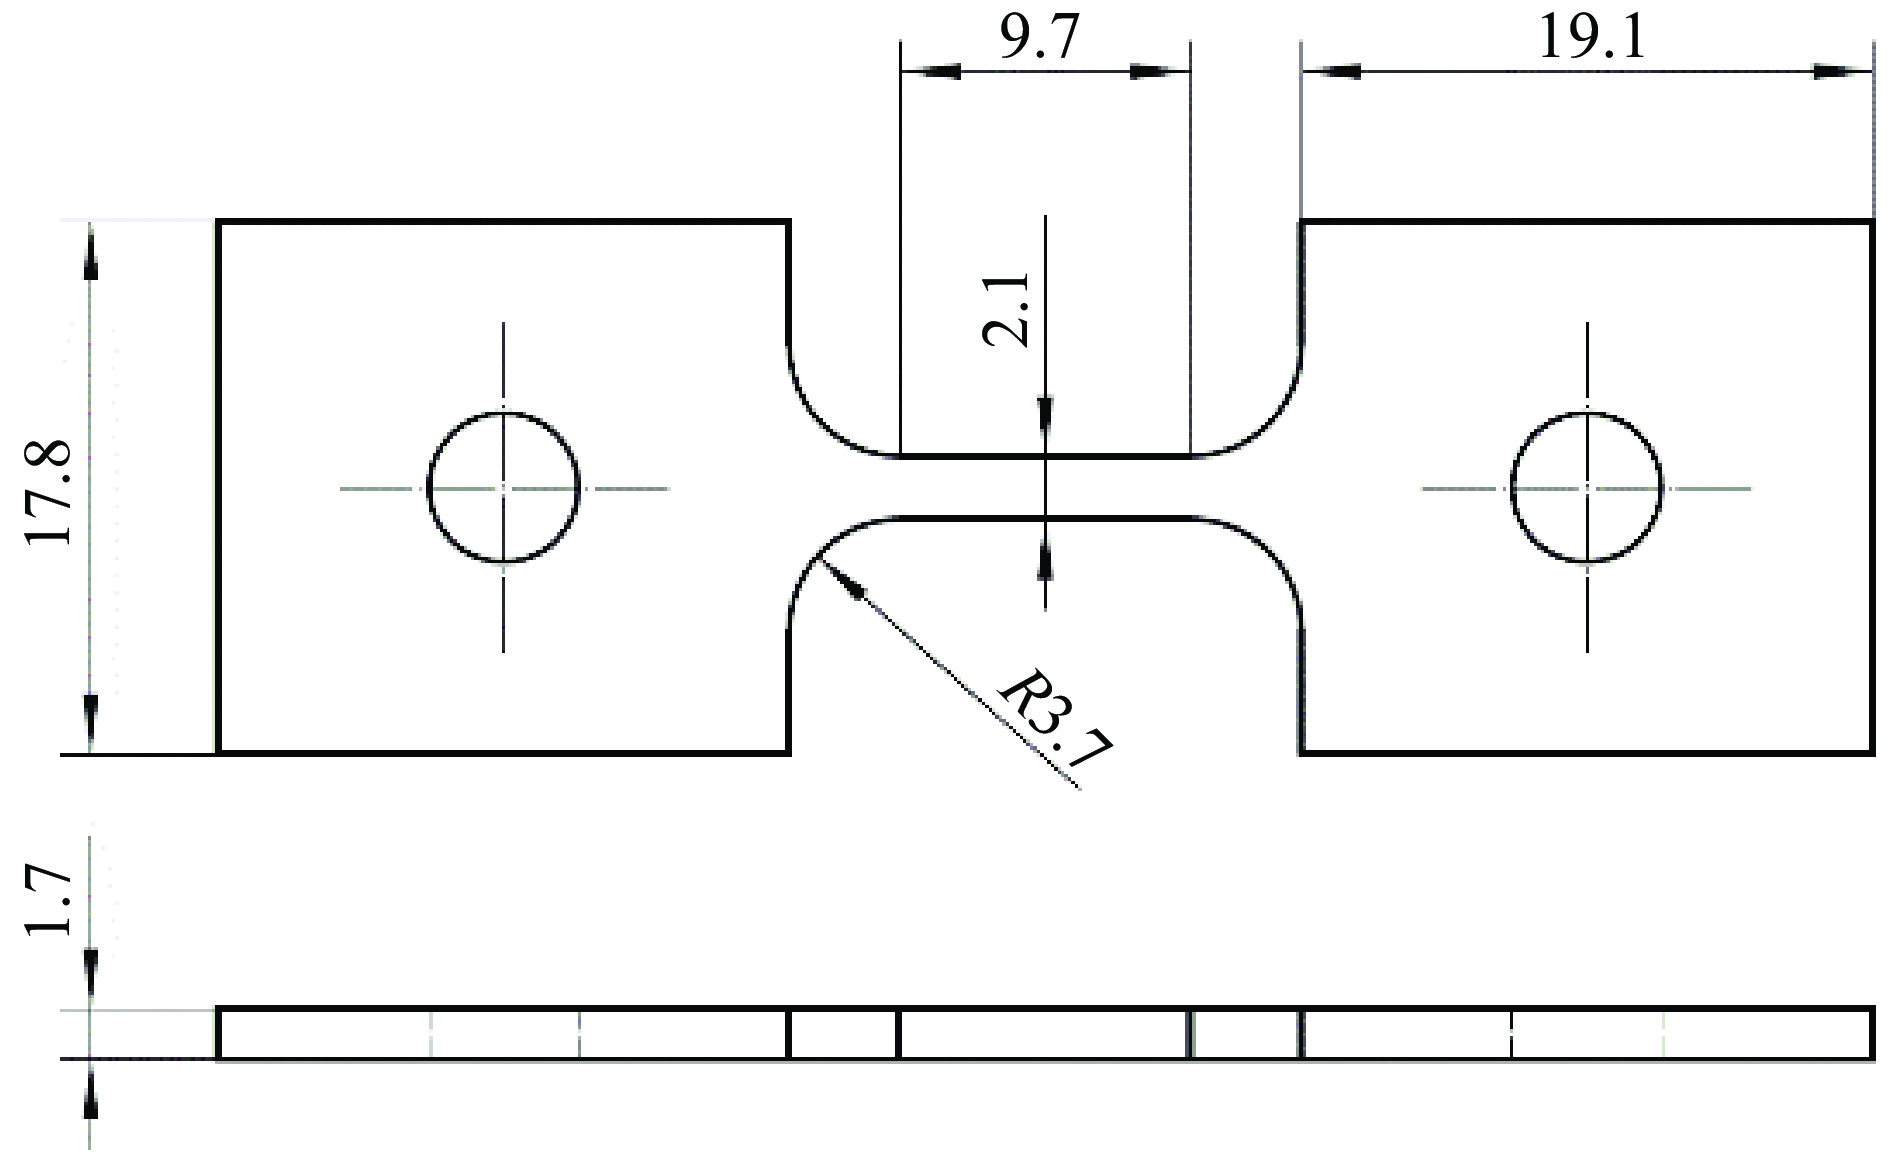
图 10 优化后试样结构及尺寸(单位:mm)
Figure 10. Optimized specimen structure and dimensions (unit: mm)
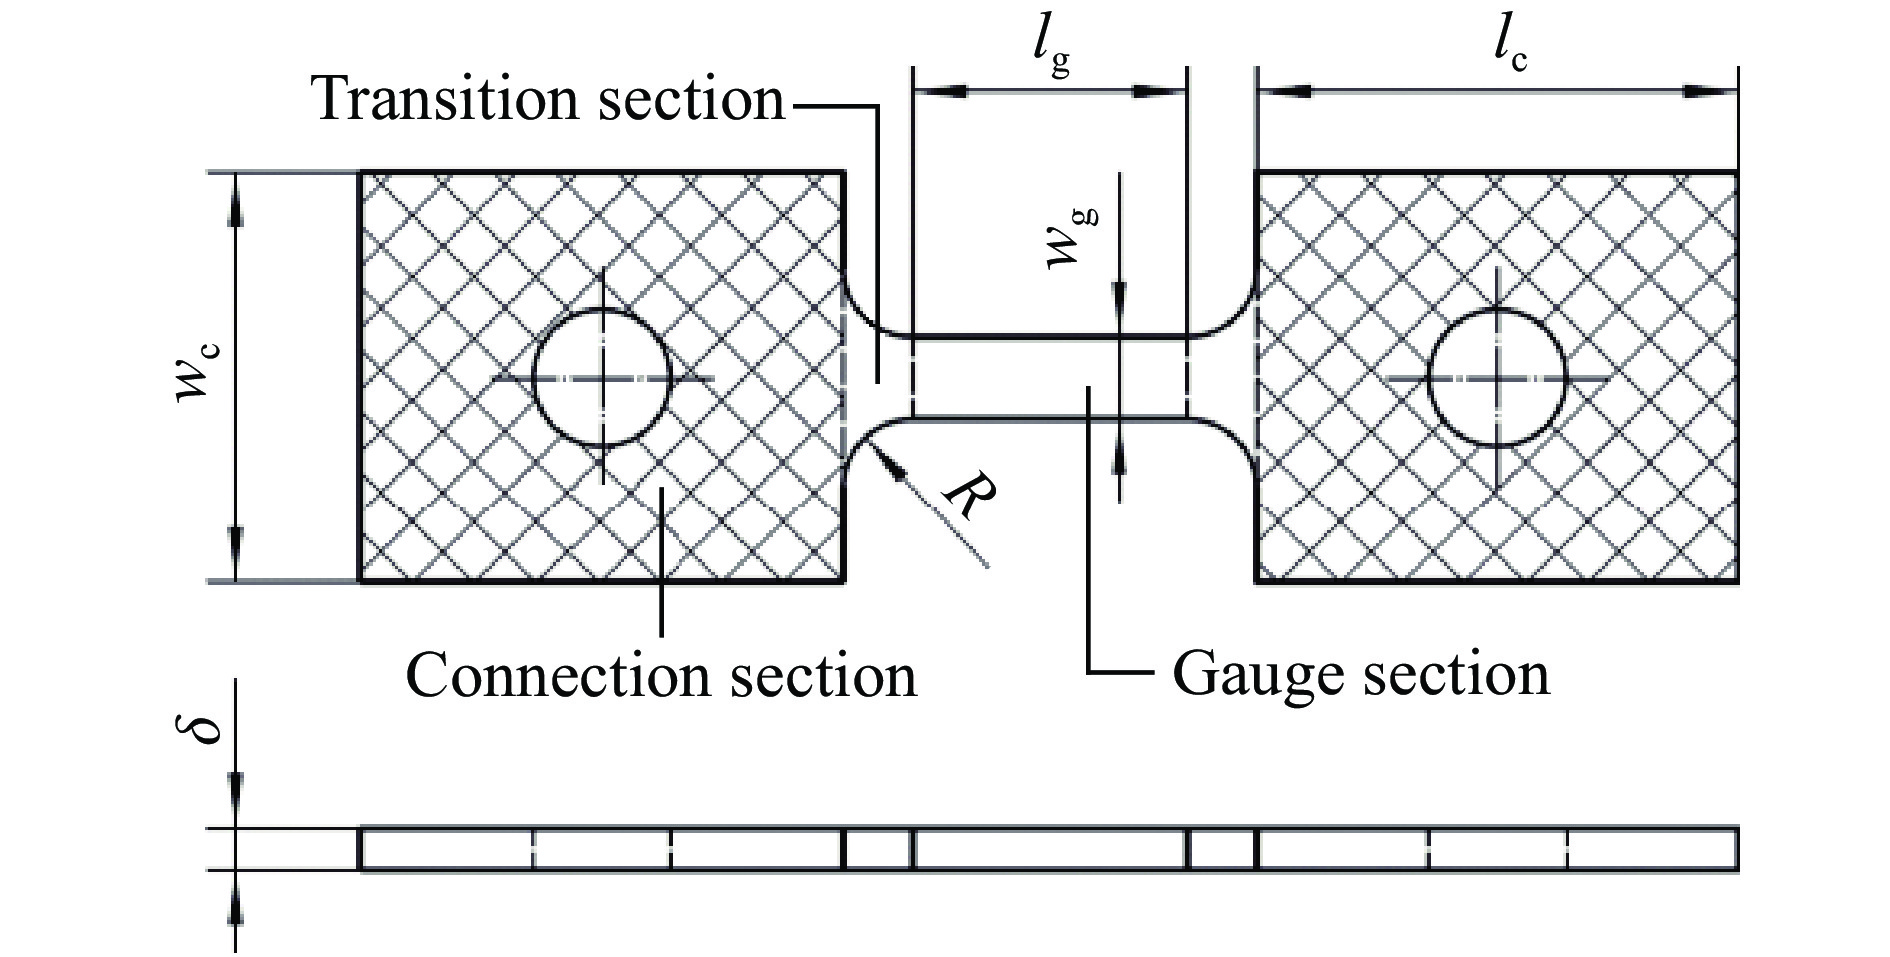
表 1 片状动态拉伸试样结构参数及其惯用值
Table 1. Structural parameters of the sheet specimen used for dynamic tensile tests and the reference values
lg/mm wg/mm lc/mm wc/mm R/mm $ \delta $/mm 12.0 4.0 18.0 16.0 3.0 2.0  下载: 导出CSV
表 2 试样结构参数正交表与模拟结果
Table 2. Orthogonal table of the specimen structural parameters and the simulation results
序号 结构参数/mm t/μs $ {\bar{\sigma }}_{\mathrm{m}} $/% s2/10−3 $ {\bar{D}}_{\mathrm{d}} $/% lg wg lc wc R δ 01 6.0 2.0 16.0 14.0 0.5 1.0 18.05 4.55 2.241 0.57 02 6.0 3.0 17.0 15.0 1.0 1.5 18.50 6.11 2.176 3.54 03 6.0 4.0 18.0 16.0 2.0 2.0 19.00 5.90 1.776 7.23 04 6.0 5.0 19.0 17.0 3.0 2.5 18.00 5.76 1.874 11.44 05 6.0 6.0 20.0 18.0 4.0 3.0 19.50 6.17 1.412 15.58 06 8.0 2.0 18.0 17.0 1.0 3.0 18.50 2.94 1.930 2.01 07 8.0 3.0 19.0 18.0 2.0 1.0 19.50 2.59 0.865 4.83 08 8.0 4.0 20.0 14.0 3.0 1.5 20.00 3.33 0.765 8.47 09 8.0 5.0 16.0 15.0 4.0 2.0 20.00 4.29 0.753 12.17 10 8.0 6.0 17.0 16.0 0.5 2.5 21.01 8.42 4.844 1.90 11 10.0 2.0 20.0 15.0 2.0 2.5 22.00 1.68 0.807 3.73 12 10.0 3.0 16.0 16.0 3.0 3.0 22.00 2.63 0.651 6.54 13 10.0 4.0 17.0 17.0 4.0 1.0 23.12 1.91 0.414 9.65 14 10.0 5.0 18.0 18.0 0.5 1.5 21.99 6.32 3.203 1.19 15 10.0 6.0 19.0 14.0 1.0 2.0 21.00 6.88 2.925 2.34 16 12.0 2.0 17.0 18.0 3.0 2.0 23.50 1.39 0.357 5.17 17 12.0 3.0 18.0 14.0 4.0 2.5 24.00 1.99 0.316 8.14 18 12.0 4.0 19.0 15.0 0.5 3.0 21.32 5.21 1.972 1.06 19 12.0 5.0 20.0 16.0 1.0 1.0 21.99 4.58 1.852 1.70 20 12.0 6.0 16.0 17.0 2.0 2.0 23.00 4.46 1.651 4.18 21 14.0 2.0 19.0 16.0 4.0 1.5 26.00 0.94 0.146 6.99 22 14.0 3.0 20.0 17.0 0.5 2.0 24.51 3.53 1.295 0.74 23 14.0 4.0 16.0 18.0 1.0 2.5 25.11 3.93 1.205 1.77 24 14.0 5.0 17.0 14.0 2.0 3.0 25.03 3.95 0.805 4.00 25 14.0 6.0 18.0 15.0 3.0 1.0 25.50 3.39 0.750 5.18
下载: 导出CSV
表 3 模拟用材料模型参数
Table 3. Parameters of the material model used for simulations
材料 密度/(kg·m−3) 弹性模量/GPa 泊松比 Johnson-Cook 模型参数 A/MPa B/MPa N C 45钢 7 850 210 0.30 AA7075-T6 2 800 71 0.33 473 210 0.3813 0.033
下载: 导出CSV
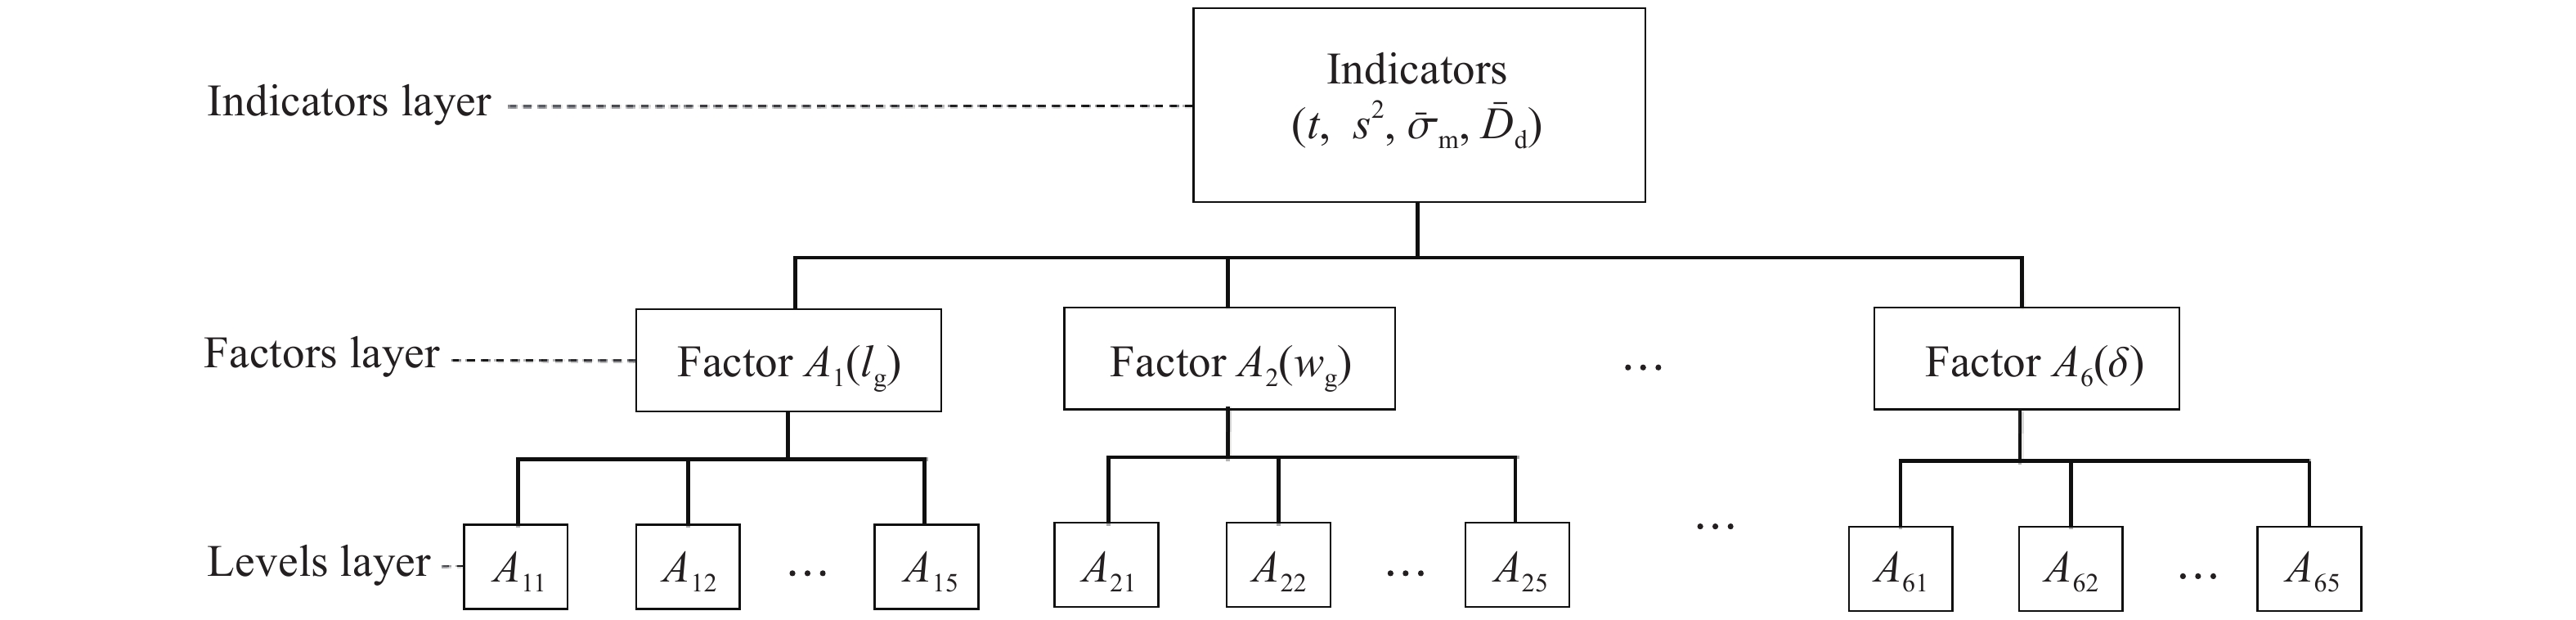
表 4 试样结构参数对测量精度指标影响的主次顺序及规律
Table 4. The influence order and law of the specimen structural parameters on the measurement accuracy indicators
指标 主次顺序 关键因素 规律 t lg, R, lc, δ, wg, wc lg、R lg、R与t呈正相关 s2 R, lg, wg, δ, wc, lc R、lg R、lg与s2呈负相关 $ {\bar{\sigma }}_{\mathrm{m}} $ wg, R, lg, δ, wc, lc wg、R wg与$ {\bar{\sigma }}_{\mathrm{m}} $呈正相关,R与$ {\bar{\sigma }}_{\mathrm{m}} $呈负相关 $ {\bar{D}}_{\mathrm{d}} $ R, lg, wg, δ, lc, wc R、lg R与$ {\bar{D}}_{\mathrm{d}} $呈正相关,lg与$ {\bar{D}}_{\mathrm{d}} $呈负相关
下载: 导出CSV
表 5 验证集
Table 5. Validation data set
编号 结构参数/mm t/μs $ {\bar{\sigma }}_{\mathrm{m}} $/% s2/10–3 $ {\bar{D}}_{\mathrm{d}} $/% lg wg lc wc R δ 01 6.0 3.0 18.0 15.0 2.0 1.5 16.0 4.45 1.018 7.02 02 8.0 2.0 16.0 14.0 3.0 1.0 18.5 1.24 0.275 7.59 03 10.0 4.0 19.0 17.0 1.0 2.5 21.0 5.43 1.946 2.34
下载: 导出CSV
表 6 验证集真实值与预测值的对比
Table 6. Comparison of the true and predicted values of the validation dataset
编号 t ${\bar{\sigma } }_{\mathrm{m} }$ s2 ${\bar{D} }_{\mathrm{d} }$ 真实值/μs 预测值/μs 误差/% 真实值/% 预测值/% 误差/% 真实值/10–3 预测值/10–3 误差/% 真实值/% 预测值/% 误差/% 01 16.00 15.62 2.38 4.45 4.87 9.44 1.018 1.072 5.30 7.02 6.73 4.13 02 18.50 17.36 6.16 1.24 1.37 10.48 0.275 0.261 5.09 7.59 8.18 7.77 03 21.00 20.78 1.05 5.43 4.99 8.10 1.946 1.778 8.63 2.34 2.43 3.85
下载: 导出CSV
表 7 优化前后试样测量准确度指标对比
Table 7. Comparison of the measurement accuracy indicators of specimens before and after optimization
t $ {\bar{\sigma }}_{\mathrm{m}} $ s2 $ {\bar{D}}_{\mathrm{d}} $ 优化前/μs 优化后/μs 减小/% 优化前/% 优化后/% 减小/% 优化前/10−3 优化后/10−3 减小/% 优化前/% 优化后/% 减小/% 27.0 21.0 22.2 2.4 1.57 34.6 0.871 0.803 7.8 5.57 5.16 7.9
下载: 导出CSV
-
[1] 蔡明, 陈伟, 陈利强, 等. TC8钛合金的动态力学性能及本构关系 [J]. 机械工程材料, 2020, 44(12): 80–84. DOI: 10.11973/jxgccl202012015.CAI M, CHEN W, CHEN L Q, et al. Dynamic mechanical properties and constitutive relation of TC8 titanium alloy [J]. Materials for Mechanical Engineering, 2020, 44(12): 80–84. DOI: 10.11973/jxgccl202012015. [2] 杨建兴, 张江涛, 乔炎亮, 等. 硅橡胶动态压缩性能SHPB测试方法及其本构模型研究 [J]. 高分子通报, 2021(4): 27–34. DOI: 10.14028/j.cnki.1003-3726.2021.04.004.YANG J X, ZHANG J T, QIAO Y L, et al. SHPB test method for the dynamic compressive properties and dynamic constitutive model of silicon rubber [J]. Polymer Bulletin, 2021(4): 27–34. DOI: 10.14028/j.cnki.1003-3726.2021.04.004. [3] FENG F, HUANG S Y, MENG Z H, et al. A constitutive and fracture model for AZ31B magnesium alloy in the tensile state [J]. Materials Science and Engineering: A, 2014, 594: 334–343. DOI: 10.1016/j.msea.2013.11.008. [4] LIU Z, DONG Y, MAO P L, et al. Dynamic tensile and compressive properties of vacuum and ordinary die-casting AT72 magnesium alloy at high strain rates [J]. Journal of Magnesium and Alloys, 2013, 1(2): 150–162. DOI: 10.1016/j.jma.2013.07.004. [5] OGAWA K. Impact-tension compression test by using a split-Hopkinson bar [J]. Experimental Mechanics, 1984, 24(2): 81–86. DOI: 10.1007/BF02324987. [6] HARDING J, WOOD E O, CAMPBELL J D. Tensile testing of materials at impact rates of strain [J]. Journal of Mechanical Engineering Science, 1960, 2(2): 88–96. DOI: 10.1243/JMES_JOUR_1960_002_016_02. [7] HUH H, KANG W J, HAN S S. A tension split Hopkinson bar for investigating the dynamic behavior of sheet metals [J]. Experimental Mechanics, 2002, 42(1): 8–17. DOI: 10.1007/BF02411046. [8] VERLEYSEN P, DEGRIECK J, VERSTRAETE T, et al. Influence of specimen geometry on split Hopkinson tensile bar tests on sheet materials [J]. Experimental Mechanics, 2008, 48(5): 587–589. DOI: 10.1007/s11340-008-9149-x. [9] VERLEYSEN P, BENEDICT V, VERSTRAETE T, et al. Numerical study of the influence of the specimen geometry on split Hopkinson bar tensile test results [J]. Latin American Journal of Solids and Structures, 2009, 6(3): 285–298. DOI: 10.1007/s12205-009-0371-6. [10] XU W F, HUANG X C, HAO Z M, et al. Effect of the geometric shapes of specimens on impact tensile tests [J]. Journal of Zhejiang University: Science A, 2010, 11(10): 817–821. DOI: 10.1631/jzus.A1000139. [11] SUN X, SOULAMI A, CHOI K S, et al. Effects of sample geometry and loading rate on tensile ductility of TRIP800 steel [J]. Materials Science and Engineering: A, 2012, 541: 1–7. DOI: 10.1016/j.msea.2011.12.115. [12] ROTBAUM Y, RITTEL D. Is there an optimal gauge length for dynamic tensile specimens? [J]. Experimental Mechanics, 2014, 54(7): 1205–1214. DOI: 10.1007/s11340-014-9889-8. [13] PRABOWO D A, KARIEM M A, GUNAWAN L. The effect of specimen dimension on the results of the split-Hopkinson tension bar testing [J]. Procedia Engineering, 2017, 173: 608–614. DOI: 10.1016/j.proeng.2016.12.114. [14] NGUYEN K H, LEE C W, SHIN H, et al. A study on the effects of specimen geometry on measurement accuracy of dynamic constitutive properties of metals using SHTB [J]. International Journal of Precision Engineering and Manufacturing, 2020, 21(9): 1687–1695. DOI: 10.1007/s12541-020-00368-y. [15] 郭伟国, 李玉龙, 索涛. 应力波基础简明教程 [M]. 西安: 西北工业大学出版社, 2007: 131−132. [16] BAYRAMIN B, ŞIMŞIR C, EFE M. Dynamic strain aging in DP steels at forming relevant strain rates and temperatures [J]. Materials Science and Engineering: A, 2017, 704: 164–172. DOI: 10.1016/j.msea.2017.08.006. [17] JIANG B H, CAO L B, ZHU F. Dynamic tensile behavior of polypropylene with temperature effect [J]. Composites Part B: Engineering, 2018, 152: 300–304. DOI: 10.1016/j.compositesb.2018.08.133. [18] BARDELCIK A, SALISBURY C P, WINKLER S, et al. Effect of cooling rate on the high strain rate properties of boron steel [J]. International Journal of Impact Engineering, 2010, 37(6): 694–702. DOI: 10.1016/j.ijimpeng.2009.05.009. [19] SMERD R, WINKLER S, SALISBURY C, et al. High strain rate tensile testing of automotive aluminum alloy sheet [J]. International Journal of Impact Engineering, 2005, 32(1/2/3/4): 541–560. DOI: 10.1016/j.ijimpeng.2005.04.013. [20] 徐仲安, 王天保, 李常英, 等. 正交试验设计法简介 [J]. 科技情报开发与经济, 2002, 12(5): 148–150. DOI: 10.3969/j.issn.1005-6033.2002.05.084.XU Z A, WANG T B, LI C Y, et al. Brief introduction to the orthogonal test design [J]. Sci/Tech Information Development & Economy, 2002, 12(5): 148–150. DOI: 10.3969/j.issn.1005-6033.2002.05.084. [21] 陈建华, 周晨佳, 王雪, 等. 基于正交试验的高速井泵优化设计 [J]. 排灌机械工程学报, 2021, 39(5): 457–463. DOI: 10.3969/j.issn.1674-8530.19.0227.CHEN J H, ZHOU C J, WANG X, et al. Optimization design of high-speed well pump based on orthogonal experiment [J]. Journal of Drainage and Irrigation Machinery, 2021, 39(5): 457–463. DOI: 10.3969/j.issn.1674-8530.19.0227. [22] DAVIES E D H, HUNTER S C. The dynamic compression testing of solids by the method of the split Hopkinson pressure bar [J]. Journal of the Mechanics and Physics of Solids, 1963, 11(3): 155–179. DOI: 10.1016/0022-5096(63)90050-4. [23] VERLEYSEN P, DEGRIECK J. Non-homogeneous and multi-axial stress distribution in concrete specimens during split Hopkinson tensile tests [J]. Computers & Structures, 2000, 77(6): 669–676. DOI: 10.1016/S0045-7949(00)00022-5. [24] SONG B, CHEN W. Dynamic stress equilibration in split Hopkinson pressure bar tests on soft materials [J]. Experimental Mechanics, 2004, 44(3): 300–312. DOI: 10.1007/BF02427897. [25] ZHANG D N, SHANGGUAN Q Q, XIE C J, et al. A modified Johnson-Cook model of dynamic tensile behaviors for 7075-T6 aluminum alloy [J]. Journal of Alloys and Compounds, 2015, 619: 186–194. DOI: 10.1016/j.jallcom.2014.09.002. [26] 周玉珠. 正交试验设计的矩阵分析方法 [J]. 数学的实践与认识, 2009, 39(2): 202–207.ZHOU Y Z. A matrix analysis of orthogonal design [J]. Mathematics in Practice and Theory, 2009, 39(2): 202–207. [27] 何龙, 张冉阳, 赵刚要, 等. 基于BP神经网络的GH5188高温合金本构模型 [J]. 特种铸造及有色合金, 2021, 41(2): 223–226.HE L, ZHANG R Y, ZHAO G Y, et al. Constitutive model of GH5188 superalloy based on BP neural network [J]. Special Casting & Nonferrous Alloys, 2021, 41(2): 223–226. [28] NARAYANA P L, LEE S W, PARK C H, et al. Modeling high-temperature mechanical properties of austenitic stainless steels by neural networks [J]. Computational Materials Science, 2020, 179: 109617. DOI: 10.1016/j.commatsci.2020.109617. [29] 王小平, 曹立明. 遗传算法: 理论、应用与软件实现 [M]. 西安: 西安交通大学出版社, 2002: 1−15. -


计量
- 文章访问数: 517
- HTML全文浏览量: 294
- PDF下载量: 52
- 被引次数: 0